Curated OER
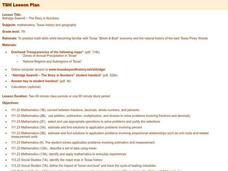
Aldridge Sawmill - The Story in Numbers
Seventh graders practice math skills while becoming familiar with Texas' "Boom & Bust" economy and the natural history of the east Texas Piney Woods. They utilize worksheets and websites imbedded in this plan.
Curated OER
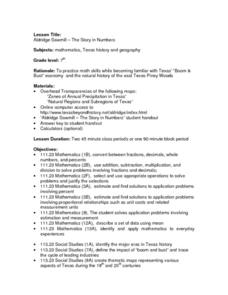
Aldridge Sawmill - The Story in Numbers
Seventh graders view overhead maps of Texas, explore history of Aldrige Sawmill, and practice math skills while becoming familiar with Texas' "Boom & Bust" economy and natural history of east Texas Piney Woods.
Curated OER
Aldridge Sawmill -- The Story in Numbers
Seventh graders view a recent transparency of the average rainfall zones of the state of Texas. Using another transparency, they identify the Piney Woods subregion of the Gulf Coastal Plain and locate national forests and sawmills. ...
Curated OER
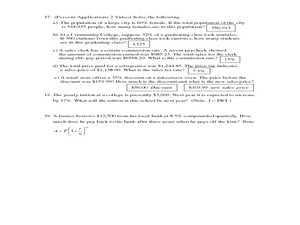
Practice Exam #03
In this math review worksheet, students complete problems including simplifying, rounding, decimals, fractions, and more. Students complete 19 problems.
Curated OER
Nutrition Awareness
Students gain an awareness of nutrition. In this science lesson plan, students explore how to determine his or her ideal body weight, demonstrate familiarity with the food groups relating to kilocaloric content, estimate the basic...
Curated OER
Human Footprint
Students study facts about humans and how they are impacting the Earth. In this investigative lesson plan students help map peoples footprints over the Earth's surface and evaluate these factors.
Curated OER
Acid-Base Titrations without Burets
Students analyze the level of acid and base in a titration. In this chemistry lesson, students investigate the amount of acid and base required to create certain household chemicals. They perform this activity without the use of burets.
Curated OER
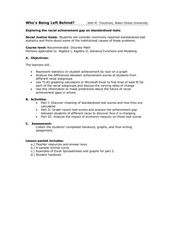
Who is Being Left Behind?
Students investigate scores as they relate to race. In this algebra lesson, students analyze standardized scores and how race can affect these scores. They plot their findings on a graph and draw conclusions.
Curated OER
Taste the Rainbow
Middle schoolers practice estimating and graphing by utilizing Skittles. In this statistics lesson, students complete worksheets based on the likelihood of a certain color of skittle coming out of the bag. Middle schoolers...
Curated OER
Probability at Play
In this probability worksheet, students read data regarding a ring toss game and respond to 4 short answer questions pertaining to probability.
Curated OER
Deer Population
Ninth graders study deer including their reproduction rate and management in Pennsylvania. In this deer overpopulation lesson students estimate deer population and suggest management tools.
Curated OER
U.S. Beach Attendance
In this bar graphs worksheet, students analyze the information about beach attendance over a period of 5 years. Students solve 3 story problems about the graph.
Curated OER
Marvelous Mathematics
Learners make a table on the computer, but create fractions and equivalent fractions through the use of color. They are able to manipulate fractions in order to gain a greater understanding of the meaning of whole number that is broken...
Curated OER
Composition of Ocean Water
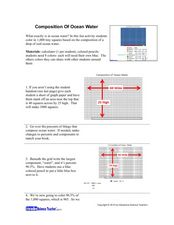
Students experiment to determine the composition of ocean water. In this ocean water composition lesson, students color in a grid that shows the percentage of each of the components of ocean water which include chloride, sodium, sulfate,...
Curated OER
Pi Day (March 14)
Fourth graders determine the value of ? by measuring the circumference and diameter of circular objects such as soup cans, Oreo cookies, etc..
Curated OER
Chaos
Students explore the concept of probability. In this probability lesson, students use a applet that demonstrates chaos and probability of spread for a forest fire. Students also play applets about the Game of Life and Rabbits and Wolves,...
Curated OER
Miami Seaquarium and Mathematics
Eighth graders, in groups, go on an imaginary field trip to Miami Seaquarium and figure out what the total cost of the trip would be.
Curated OER
Osmosis
In this biology worksheet, students determine how many solvent and solute molecules there are in the red blood cell and the IV fluid. Then they determine whether the IV fluid is hypertonic, hypotonic, or isotonic to the red blood cell.
Curated OER
Using Inequalities to Problem Solve
Learners explore inequalities. For this Algebra I lesson, students solve and graph linear inequalities involving addition, subtraction, multiplication, or division. Learners use inequalities to solve and graph real-world problems.
Curated OER
The Circle's Measure
Students explore circumference and diameter. In this math lesson, students apply their knowledge of circumference and diameter to solve mathematical riddles. Students apply this knowledge to find circumference and diameter of various...
Curated OER
Read the Label
Learners read the Nutrition Fact labels to make healthy choices. In this health instructional activity, students look at labels to identify fat content, protein, carbohydrates, and serving size. They play games with different labels such...
Curated OER
Our Favorites
Learners participate in and conduct a survey to determine various class favorites. They collect, organize and display their data, interpret the results, and complete a packet of worksheets to display the information.
Curated OER
Determining the Age of Fossils
Students examine the concept of radioactive dating. In this radioactive dating lesson, students investigate how to determine the ages of fossils and rocks as they learn about half-life radioactive decay.


