Curated OER
Coal Supply and Demand
A hands-on simulation perfect for an economics lesson, young learners investigate the availability of different sources of natural energy (coal, natural gas, oil, solar, and nuclear) and how this availability affects their cost....
Kenan Fellows
Isotopic Pennies
Many people confuse atomic mass and atomic numbers. The sixth of seven lessons in a unit requires scholars to find the weight of different groups of pennies. Then, they must solve how many of each type of penny exists in a closed system...
Houghton Mifflin Harcourt
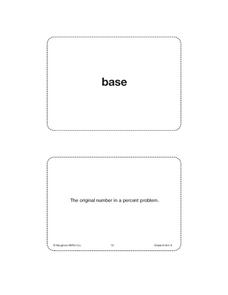
Unit 6 Math Vocabulary Cards (Grade 6)
Fifty-eight flashcards make up a set designed to reinforce math vocabulary. Within the set, you'll find bold-faced word cards as well as definition cards that offer a labeled example. Terms include base, percent, theoretical...
Willow Tree
Circle Graphs
Pie isn't just for eating! Scholars learn to create pie charts and circle graphs to represent data. Given raw data, learners determine the percent of the whole for each category and then figure out the degree of the circle that percent...
Beyond Benign
Product Test
It's the moment of truth. Previous lessons in the 24-part series had scholars design and develop shampoo formulas using chemical concepts. The 18th lesson asks them to test the function of their shampoos. To do this, they calculate the...
CCSS Math Activities
Sandwich Shop
Eat up the task on systems of equations. Given information on the total number of sandwiches and the total income, learners write and solve a linear system of equations to find the number of each type of sandwich sold at a shop. They...
EngageNY
Margin of Error When Estimating a Population Mean (part 1)
We know that sample data varies — it's time to quantify that variability! After calculating a sample mean, pupils calculate the margin of error. They repeat the process with a greater number of sample means and compare the results.
Bowland
Mystery Tours – Plan Your Tour
Everyone loves a vacation and a set of three activities has groups planning a tour of the U.K. using given distance, time, and price data. They solve a variety of problems related to the trip and produce a report on the success of...
Curated OER
Deal or No Deal?
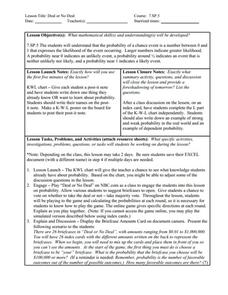
Using a game format, learners engage in an activity called Deal or No Deal. Taking real life scenarios involving items for sale, such as cereal boxes three for $5.00, they determine whether an example is a deal or not. This lesson...
EngageNY
Margin of Error When Estimating a Population Proportion (part 1)
Use the power of mathematics to find the number of red chips in a bag — it's a little like magic! The activity asks learners to collect data to determine the percentage of red chips in a bag. They calculate the margin of error and...
Curated OER
Stock Market Math
Young scholars calculate commission for a stock transaction through a broker using the relationship between percentages and decimals. They decide which stocks are preferable based on the price to earnings ratios listed on the stock...
Kentucky Adult Education
Probability Lesson Plan
Roll the dice with this multimedia math lesson on probability. After first viewing a series of three short videos explaining probability, independent events, and dependent events, young mathematicians complete a set...
Mathed Up!
Fractions of an Amount
After viewing a video on fractional amounts, young mathematicians put their new knowledge to the test. Throughout the assessment, class members find the fractional amount for prices, times, and populations. There are a few percent and...
Willow Tree
Simple Probability
The probability of learning from this activity is high! Learners calculate probabilities as numbers and as decimals. They see how to use a complement to find a probability and even try a simple geometric probability problem.
EngageNY
Margin of Error When Estimating a Population Mean (part 2)
Don't leave your classes vulnerable in their calculations! Help them understand the importance of calculating a margin of error to represent the variability in their sample mean.
Mathematics Assessment Project
Ratios and Proportional Relationships
Time to see what they've learned. Seventh graders solve a set of seven short problems in the ratios and proportional relationships domain. Applications include photo negatives, washing machines, coffee powder, sleep, stamps, etc.
Math Worksheets Land
Patterns of Association (Using Data Tables) - Guided Lesson
The activity belongs to a four-part resource that applies percentages to data tables. The page has three practice problems that continues with the development of this topic.
Inside Mathematics
Archery
Put the better archer in a box. The performance task has pupils compare the performance of two archers using box-and-whisker plots. The resource includes sample responses that are useful in comparing individuals' work to others.
Beyond Benign
Can You Hear Me Now? Cell Phone Accounts
How sustainable are cell phones? Throughout the unit, learners explore the issues around cell phones concerning sustainability. Class members take a graphical look at the number of cell phones across the world using a box-and-whisker...
Beyond Benign
In a Lather
Time to come clean! Scholars continue preparing the shampoo they created in the previous two lessons. The purpose of this stage is to calculate the perfect amount of additive to make the shampoo lather.
Bowland
Explorers – Patrol Services
Far out — plan a trip to space! Aspiring mathematicians steer a space vehicle through an asteroid field, calculate currency exchanges to buy provisions, and determine placement of charges to blow up asteroids. Along the way, they learn...
Mathematics Assessment Project
Middle School Mathematics Test 6
A thorough math test divides the content into two 40-minutes sections, covering material through algebra and geometry. Problems incorporate analysis and applied problem solving.
Balanced Assessment
Who's Left?
If you're not right-handed, are you wrong-handed? Young statisticians calculate the percentage of left-handed people using a given data set in the assessment task. They plot data on a scatter plot and consider how the line of best fit...
EngageNY
Margin of Error When Estimating a Population Proportion (part 2)
Error does not mean something went wrong! Learners complete a problem from beginning to end using concepts developed throughout the last five lessons. They begin with a set of data, determine a population proportion, analyze their result...


