Curated OER
Baseball Relationships - Using Scatter Plots
Students use graphing calculators to create scatter plots of given baseball data. They also determine percentages and ratios, slope, y-intercepts, etc. all using baseball data and statistics.
Curated OER
Finding the Area Under A Curve with Random Probability
Young scholars explore the concept of area under a curve. In this area under a curve lesson, students find the area under a curve using the Monte Carlo method using random points and probability. Young scholars calculate the area under...
Curated OER
Epidemic Proportions
Students research epidemics that have devastated world population at various points in history. They share and calculate statistics obtained in their research and develop graphs comparing and contrasting how different epidemics affect...
Curated OER
Trophic Ecology of Humans
young scholars analyze the place of humans among the tropic levels by observing what we eat. They calculate the caloric content of several foods commonly eaten by humans and calculate the total energy cost to grow, process, transport,...
Curated OER
Pen Light Lab
Students study what makes Earth warm and explore how different locations on the planetreceive different amounts of solar energy based on the intensity of the sun's rays. They calculate light intensities and compare the
amounts of light...
Curated OER
Home Sales Records
Teach your class how to calculate monthly payments on a home mortgage. In this percent lesson, young scholars calculate the monthly payment on a home mortgage, and compare different lengths of time and the interest rates for national...
Curated OER
How Much are You Worth?
In this body elements worksheet, students use a table given the percentage of each element that composes the body to find their worth. The value of each element is given and students calculate what their bodies would be worth if they...
Michigan Sea Grant
Water Quantity
It may be tricky for a young mind to conceptualize that less than 1% of all water on earth is useable for humans to drink. Simulating the amount of fresh water available on earth by removing measured amounts of water from a five-gallon...
Curated OER
World in the Balance
Students explore population growth. They calculate how long it takes a country's population to double in size and to investigate factors affecting growth rate. In addition, they list of factors they think might affect growth rate
Curated OER
How Much Sugar is in Bubble Gum?
Students conduct an experiment to determine the percentage of sugar in various types of gum. They weigh the gum after chewing it to determine the amount of mass lost from each piece of gum, analyze the data, and create a graph of the...
Curated OER
Count The Letters
Students perform activities involving ratios, proportions and percents. Given a newspaper article, groups of students count the number of letters in a given area. They use calculators and data collected to construct a pie chart and bar...
Curated OER
Trophic Ecology of Humans
Students analyze the trophic level of humans by first calculating the kilocalories in own their lunch. They then calulate the kilocalories in a wide variety of foods found in grocery stores and compare the kilocalories needed to acquire...
Curated OER
Moooving to Low-fat Milk
Third graders complete two handouts. In this healthy beverages lesson, 3rd graders compare whole, two percent and skim milks. Students use labels to help choose healthy beverages. Students complete an "All About Milk" and "Calculating...
Curated OER
Inflation: Taking Prices Higher
Students examine the definition of inflation and its impact through history. They read and discuss online text, discuss examples of inflation, calculate the prices of various items for different years using an inflation rate of 3%, and...
Curated OER
Isotopes Worksheet #1
In this isotopes worksheet, high schoolers find the average atomic mass given the masses of two isotopes. They also calculate the atomic mass of elements given the percentages of each isotope.
Curated OER
Seeing a Dwarf Planet Clearly: Pluto
In this dwarf planet worksheet, students use images from the Hubble Space Telescope and they determine the scale of the image, they identify the largest features in the images, they calculate the volume of Pluto and they create a model...
Curated OER
Government Goods and Services
Fifth graders investigate the connection between taxes and government services. In this economics lesson, 5th graders discuss the process and benefits of paying sales and income taxes. Using calculators, students compute the amount of...
Curated OER
Empirical and Molecular Formula Sheet
In this formulas worksheet, students solve eight problems and are required to write the empirical and molecular formulas given percentage of elements or quantities in mass.
Curated OER
Limiting Reactant-Theoretical Yield and Percent Yield
In this limiting reactant learning exercise, students solve four problems to identify the theoretical yield and percent yield given an equation. They also calculate the limiting reactant.
Curated OER
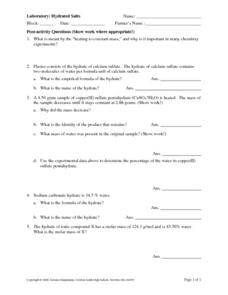
Laboratory: Hydrated Salts
In this hydrated salt worksheet, learners answer questions after completing a lab experiment using a hydrated salt. The calculate the empirical formula for the hydrate, they name the hydrate and they determine the mass of the water in...
Curated OER
Leveled Problem Solving: Circle Graphs
In this circle graphs worksheet, students solve 6 word problems based on a circle graph about the most popular classes for sixth graders. Students calculate angle measures of circles for 2 of the problems.
Curated OER
Probability and Geometry
Students examine the relationship between probability and geometry to solve problems. In this geometry and probability lesson, students investigate the effect of changing percentages on a spinner to the probability of landing on a...
Curated OER
Fashion Sense and Dollar Wise
Students work in groups to show understanding of the relationship between fractions, decimals, percentages, and the application of ratios and proportions. In this decimals, fractions, and percents lesson, students use real life consumer...
Curated OER
Fashion Sense and Dollar Wise
Young scholars find the cost of an outfit. In this percentages lesson, students look at ads, pick out an outfit, and find the sale price. They create a commercial and complete 4 included worksheets.


