Curated OER
Real Math
Students explore careers that require math knowledge and solve real life math problems. As a class, they compare and contrast classroom math to real life math and explore the links between algebra, geometry and math skills used in...
Curated OER
Length Lotto-Teacher's Notes
Students convert metric units of length, specifically meters, centimeters, and millimeters. In this instructional activity of converting measurements, students participate in various games which require them to put the measurements in...
Curated OER
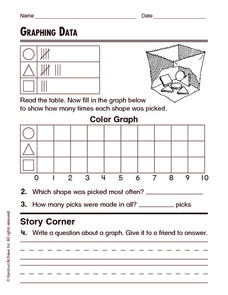
Graphing Data
In this graphing data worksheet, students solve and complete 8 different word problems related to graphing data given. First, they determine the percent of people who do not believe in any of the phenomena described and explain. Then,...
Curated OER
Average Speed in a Pinewood Derby
In this average speed worksheet, students are given the distance a derby car must travel and its time for three trials. Students find the average speed and answer four questions about the data.
Curated OER
Find the Mystery Lines...If You Can!
In this atomic spectral lines worksheet, students observe a diagram of the spectral lines, their different wavelengths and their intensity. They solve 4 problems which include interpreting the scale, matching up tabulated lines with the...
Curated OER
Magnetic Storms
In this magnetic storms and Earth's magnetic field activity, students use a bar graph showing the Kp Index for planetary variability. Students use the bar graph to answer 3 questions about the solar storms and their Kp values.
Curated OER
Do Fast CMEs Produce Intense SPEs?
In this coronal mass ejections and Solar Proton Events worksheet, students create a Venn Diagram to represent given data. They answer 5 questions about the data related to the number of coronal mass ejections and Solar Proton Events...
Curated OER
Financial News
In this financial word problems activity, students solve word problems involving decimals, interest, multiplication, and more. Students complete 7 problems.
Curated OER
The World is a Village
Learners observe Americans through the eyes of the world. In this human population lesson, students utilize the Internet to view the World Pop Clock and follow the world's population by the minute. Learners predict what the world's...
Curated OER
Design Project: DC Motor
In this DC motor worksheet, the learner answers 3 open-ended questions pertaining to the design of a DC motor. The worksheet is printable and the answers are revealed online.
Curated OER
Teaching Six Big Ideas in the Constitution
Students debate the constitutional principles of the United States. In this U.S. government lesson, students examine the meaning of the text of the U.S. Constitution and analyze other primary documents of the era. Students prepare for...
Curated OER
Infusing Equity in the Classroom by Gender
Students investigate the idea of gender descrimination in the classroom. For this algebra lesson, students collect data in stereotyping, and gender bias in the classroom, school materials and activities. They graph and analyze their...
Curated OER
Final Worksheet
Students will review a semesters worth of material on this final chemistry review. Information ranges from naming isotopes to pH and molarity.
Curated OER
Pre-calculus Unit 3 Test 2
Students will solve exponential function problems, graph exponential functions, find the value of logarithms, determine future value, and compound interest. In this Pre-calculus lesson, students will use the properties of logs to solve...
Curated OER
A Statistical Study on the Letters of the Alphabet
Students use a book or magazine to research the use of letters. They complete a worksheet and compare their results.
Curated OER
Salaries
Students are engaged in the study of salaries and how they vary according to different occupations. They conduct research using a variety of resources in order to summarize the earnings potential in the human services field.
Curated OER
Iditarod-Statistics and Rates
Students analyze data from the Iditarod race. In this data analysis lesson, students work in pairs to analyze data and answer several questions such as, "what is the difference in the rate of travel" and "how much more prize money does...
Curated OER
Camouflage and Protective Coloration: A Model of Natural Selection
Students investigate natural selection and differential survival among divergent phenotypes of a population. Using everyday items , they model adaptations of camouflage and protective coloration in two very different environments.They...
Curated OER
Budget Finances
Students role play the role of a recent graduate of high school living on their own. Using play money, they are given one month's salary and they discover they own their own house or apartment and owe money on a car loan. They develop...
Curated OER
Scatterplots
In this scatterplots worksheet, students construct a scatter plot from a given data set. Students then answer 4 questions regarding the least-squares regression line and making predictions.
Curated OER
Using Standard Deviation, part 2
Students explain and learn the practical application of standard deviation. They compare cities in the U.S. and discover whether cities closer to the ocean have more consistent temperatures. Useful resources are given.
Curated OER
What's a Per-"cent"?
Students recognize the mathematical connections between fractions and percents. They develop and study graphs to make connections between their data and what it represents. They write about the connections they have discovered.
Curated OER
What Does Percent Have to Do With It?
Fourth graders go shopping for a real life experience involving percent. They explore the concepts of sales tax and discount prices.
Curated OER
Doing The School Run
Students explore finding the percent of a numbers. They survey their peers to determine modes of transportation used in getting to school. Afterward, students organize information and create graphs and charts. They explore alternative...


