EngageNY
Fundamental Theorem of Similarity (FTS)
How do dilated line segments relate? Lead the class in an activity to determine the relationship between line segments and their dilated images. In the fourth section in a unit of 16, pupils discover the dilated line segments are...
Virginia Department of Education
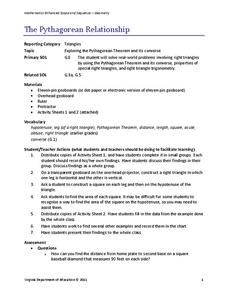
The Pythagorean Relationship
Add up areas of squares to discover the pythagorean relationship. Small groups create right triangles with squares along each side. They calculate the areas of each square and notice the relationship. Groups construct other types of...
Cornell University
Light Waves: Grades 9-12
Explore the behavior of light waves with a lab activity. Scholars build new vocabulary through experimentation and observation. Using different mediums, they model reflection, refraction, transmission, diffusion, and scattering of light.
Alabama Learning Exchange
Add, Subtract, and Multiply Matrices
Introduce the concept of matrices with a pre-designed instructional activity. Learners watch video lessons to learn the ins and outs of adding, subtracting, and multiplying matrices. Using provided problems, they practice each operation...
Utah Education Network (UEN)
The Pasture and the Fence
Beginning geometers use tiles and grid paper to draw and calculate perimeter and area. Rectangles of different sizes are created and then measured to build understanding. The one-inch grid sheet referenced is attached.
Curated OER
Bubble and Boyle
Middle-schoolers still enjoy playing with bubbles! In this series of eight laboratory activities, science learners explore convex and concave surfaces, angles, gas laws, buoyancy, density and more!
Curated OER
Shrinky Dinks® Palettes
Here is a fun and clever lesson for teaching physics classes how to calculate wavelength if given the energy and frequency data. On a worksheet, they compute wavelengths using a table of information that you provide. On a paper palette,...
Curated OER
Industrialization, Chemicals and Human Health - Math
Students review the units of the metric system, and practice estimating measures before actually converting between the two systems of measurement. They participate in activities to visualize a concentration of one part per million....
Curated OER
Arithmetic: Fractions
Mathematics aces, after a warm-up activity with some easy calculations, practice solving rules of signs and powers of 10 equations. Multiplying and dividing decimals is also covered within this instructional activity in depth. A variety...
Curated OER
Use a Table
In this elapsed time worksheet, students analyze a schedule of events at a picnic with the starting times listed. Students read and solve 6 problems in which the elapsed time is calculated.
Curated OER
Representing Patterns & Evaluating Expressions
Write algebraic expressions, determine patterns, and evaluate expressions in a real-world context. Learners engage in a series of collaborative activities to identify, model, and give variables for real-world patterns. They write...
Curated OER
Simple Inequalities
Students solve inequalities. In this inequalities lesson, students evaluate simple inequalities. They examine vocabulary words. Students participate in breath holding activities and write inequalities to represent the activity. In teams,...
Curated OER
Podcasting Parabolas
Students explore parabolas. In this algebra and technology lesson, students construct the equation of a specific parabola, then take digital photos of real-life representations of these parabolas. Students create a podcast with a...
Curated OER
Long Day?
Middle schoolers become aware of the effects of tides on the Earth's rotation. In this tides lesson, students calculate the number of seconds lost over various periods of time.
Curated OER
Middle Grades Math: Balancing Equations
Learners solve linear equations. By observing the graph of each side of an equation using the TI-nspire graphing calculator, your class gains insight into solutions, as well as balancing equations and transforming linear equations....
Curated OER
Influence and Outliers
Using the TI-Nspire calculator, statisicians identify outliers and their effect on the least-squares regression line. In finding the line of best fit, they determine what points will affect the least squares regressions and what points...


