PBS
Adventures With The Fish Pond: Population Modeling
Build up from the previous activity where your learners charted the population growth and decay of a fish pond with M&Ms®. Have them look at the data from that activity and create a Now-Next, or recursive equations, to predict the...
Virginia Department of Education
Curve of Best Fit
Which function models the data best? Pupils work through several activities to model data with a variety of functions. Individuals begin by reviewing the shapes of the functions and finding functions that will fit plotted data points. By...
Curated OER
Calculator Activity: Time Flies
For this skip count worksheet, students use a calculator to help them skip count starting with the given time and finishing 60 minutes later.
Virginia Department of Education
Organizing Topic: Data Analysis
Learners engage in six activities to lead them through the process of conducting a thorough analysis of data. Pupils work with calculating standard deviations and z-scores, finding the area under a normal curve, and sampling techniques....
EngageNY
Calculating Conditional Probabilities and Evaluating Independence Using Two-Way Tables (part 1)
Being a statistician means never having to say you're certain! Learners develop two-way frequency tables and calculate conditional and independent probabilities. They understand probability as a method of making a prediction.
Techbridge Curriculum
Calculating Rainwater Runoff
Thirsty plants soak up every bit of a rainfall, but what happens to the rain that hits the roof? Calculate the amount of rainwater from your school's roof with an Earth science activity, which brings measurement skills, observation...
Mathematics Assessment Project
Calculating Arcs and Areas of Sectors of Circles
Going around in circles trying to find a resource on sectors of circles? Here is an activity where pupils first complete an assessment task to determine the areas and perimeters of sectors of circles. They then participate in an activity...
Math Warehouse
Theoretical Probability Activity
If you keep rolling a die, you'll roll a five exactly one-sixth of the time—right? A probability lesson prompts young mathematicians to roll a die 100 times and use the data to calculate empirical probabilities. They then compare these...
CK-12 Foundation
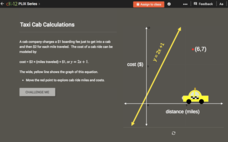
Checking Solutions to Equations: Taxi Cab Calculations
Ride to success in checking solutions to equations. Scholars use an interactive graph to identify points that are solutions to a linear equation. Interpreting these points in terms of the context completes the activity.
Curated OER
M&M’s Math Worksheet
Who knew you could cover prediction, histograms, fractions, decimals, data collection, and averages (mean, median, and mode) all with a bag of M&M's®? Here's a fantastic set of worksheets to help you make candy a mathematical journey...
Teachers Network
A World of Symmetry: Math-Geometry
Define and identify the three basic forms of symmetry translation, rotation, and glides with your class. They cut out and arrange paper pattern blocks to illustrate symmetry, create a Cartesian graph, and design a rug with a symmetrical...
Ahisma Summer Institute
The Power of One - Math in a Different Angle
In this 2-day instructional activity focused on exponents, middle schoolers will cross the curriculum by engaging in science, history and language arts activities. Exponential growth will be explored using grains of rice on a chess...
Illustrative Mathematics
How Thick Is a Soda Can I?
The humble soda can gets the geometric treatment in an activity that links math and science calculations. After a few basic assumptions are made and discussed, surface area calculations combine with density information to develop an...
Mrs. Burke's Math Page
Let Them Eat Pi
Looking for a fun and creative way to celebrate Pi Day? Then this is the resource for you. From a scavenger hunt and trivia contest to PowerPoint presentations and skills practice worksheets, this collection of materials is a...
American Statistical Association
What Fits?
The bounce of a golf ball changes the result in golf, mini golf—and a great math activity. Scholars graph the height of golf ball bounces before finding a line of best fit. They analyze their own data and the results of others to better...
Radford University
How to Calculate and Analyze the Equation for a Parabolic Path
Working in groups, pupils plot three points on the coordinate plane representing three different parabolic paths. Using a calculator, they determine the quadratic regression equation for their models. Each team then figures out the...
Radford University
Data Analysis Activity
What do classmates think? In groups, learners design surveys to investigate chosen topics. They conduct the survey, then analyze the results. As part of the activity, they must calculate the mean, median, mode, variance, and standard...
Curated OER
What's The Story?
Teams of learners integrate reading, writing, math, social studies, and science in this simple, yet effective lesson. They work in groups in order to solve a ten-step problem which requires internet research, the use of a calculator, and...
Curated OER
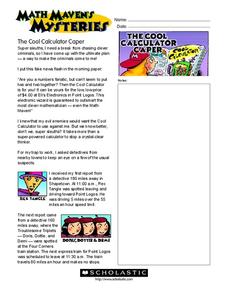
Math Maven's Mysteries
In these math word problem worksheets, students help solve the mystery about 'The Cool Calculator Caper.' Students use the formula to find what time the evil wrongdoer will arrive in Point Logos.
Curated OER
Math Can Be Electrifying
Learners explore how math can be used to calculate and analyze how electricity causes air pollution. Students design a campaign to educate family members on ways they can save electricity. They create a graph that compares two electric...
Curated OER
Dinosaur Math
Second graders practice vocabulary related to measurement, mathematics, and dinosaurs. Using the engaging topic of dinosaurs, learners will calculate various information about dinosaurs and use measurement vocabulary. They will also...
Curated OER
Industrialization, Chemicals and Human Health - Math
Students review the units of the metric system, and practice estimating measures before actually converting between the two systems of measurement. They participate in activities to visualize a concentration of one part per million....
Beyond Benign
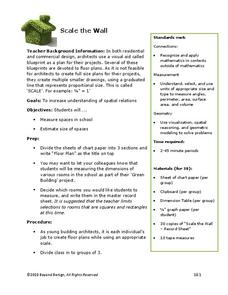
Scale the Wall
How can you fit an entire school on one sheet of paper? You use scale! Scholars measure rooms in the school and, using the correct scale, design a floor plan that includes area calculations with their data.
Curated OER
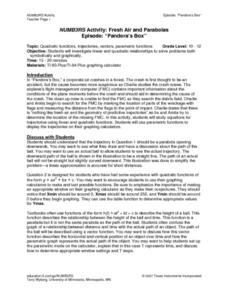
NUMB3RS Activity: Fresh Air and Parabolas
Explore parabolas and investigate linear and quadratic functions to solve problems symbolically and graphically. Also use parametric functions to display trajectories on a graphing calculator.


