Balanced Assessment
Bumpy-Ness
Develop a new measure of the properties of an object. Scholars develop a definition and formula to measure the bumpy-ness of an object. They utilize their formulas to find the property for several spherical objects.
Virginia Department of Education
Arc Length and Area of a Sector
What do skateboarding and baked goods have in common with math? You can use them to connect half-pipe ramps and cakes to arcs and sectors. Pupils compare the lengths of three different ramp options of a skate park. They calculate the...
National Research Center for Career and Technical Education
Depreciation (Double Declining)
Have you ever been told that your new car begins to lose its value as soon as you drive it off the lot? Aspiring accountants take on the concepts of depreciation and book value through an easy-to-deliver career and technology lesson. The...
Teach Engineering
Watt Meters to Measure Energy Consumption
It used watt amount of energy? This resource investigates the power usage of small household appliances. Using a watt meter, groups measure the actual wattage used by an appliance and then calculate the energy used daily.
University of Colorado
Modeling Sizes of Planets
The density of the huge planet of Saturn is 0.7 g/cm3, which means it could float in water! In the second part of 22, science pupils explore the size and order of the planets. They then calculate weight and/or gravity and density of...
Curated OER
Adding and Subtracting Integers: The Symbols + and -
This worksheet begins with an explanation of how to add and subtract positive and negative integers. Learners solve and complete 20 different problems that include these types of problems. First, they fill in each blank with the correct...
EngageNY
Association Between Categorical Variables
Investigate associations between variables with two-way tables. Scholars continue their study of two-way tables and categorical variables in the 15th installment of a 21-part module. The lesson challenges them to calculate relative...
EngageNY
Summarizing Bivariate Categorical Data in a Two-Way Table
Be sure to look both ways when making a two-way table. In the lesson, scholars learn to create two-way tables to display bivariate data. They calculate relative frequencies to answer questions of interest in the 14th part of the series.
Virginia Department of Education
Normal Distributions
Pupils work to find probabilities by using areas under the normal curve. Groups work to calculate z-scores and solve real-world problems using the empirical rule or tables.
Virginia Department of Education
Exploring Statistics
Collect and analyze data to find out something interesting about classmates. Groups devise a statistical question and collect data from their group members. Individuals then create a display of their data and calculate descriptive...
Virginia Department of Education
Algebra Tiles and Solving Equations
Young mathematicians solve linear equations by drawing models of algebra tiles using colored pencils. To finish, they solve the same equations algebraically and check their answers using a graphing calculator.
Noyce Foundation
Gym
Give the class a mental work out with an assessment task in which young mathematicians compare several gym membership options. They use substitution to calculate the cost for given numbers of months.
Curated OER
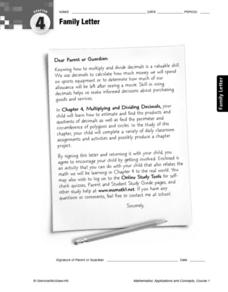
Family Letter
Middle schoolers, working with their parents, calculate and complete five word problems associated with multiplying and dividing decimals. Students research the current Federal minimum wage at the library or on the Internet.
Teaching Ideas
Volume
After understanding that the volume of a unit cube is one cubic centimeter, math masters determine the volume of four larger rectangular shapes. Then they take the challenge to figure out the volume of seven irregular, cube-containing...
Curated OER
Unit 11 Year 5
Apparently unit 11 covers a range of topics related to problem solving, addition, and subtraction. This complete unit presentation is intended for use over a series of days or weeks. It contains numerous visual aids to accompany lessons...
Teach Engineering
Just Plane Simple
It is plane to see that simple machines help reduce the force needed to perform a task. This resource introduces three of the simple machines--the inclined plane, the wedge, and the screw, and the formulas in order to be able...
Curated OER
Measuring Up
Students examine and discuss a variety of ways to measure length, capacity, and weight. They estimate and measure a pencil's length using Unifix cubes, estimate and fill a measuring cup with Unifix cubes, and weigh a calculator in a...
Curated OER
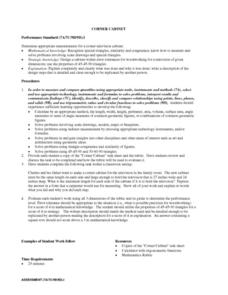
CORNER CABINET
Ninth and tenth graders calculate the length, width, height, perimeter, area, volume, surface area, angle measures or sums of angle measures of common geometric figures. They solve problems involving scale drawings, models, maps or...
Virginia Department of Education
Radical Equations
Provide high schoolers with the skill for how to examine algebraic and graphical approaches to solving radical equations. Learners solve various radical equations involving square root and cube root expressions. They first...
Virginia Department of Education
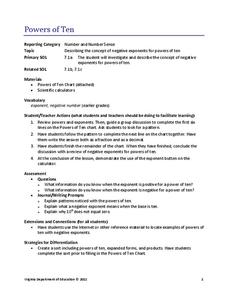
Powers of Ten
Investigate negative exponents of-ten. Pupils use the pattern of increasing powers of 10 to determine negative powers of 10. The scholars write the powers in expanded and product forms and make the connection to exponents using a...
Virginia Department of Education
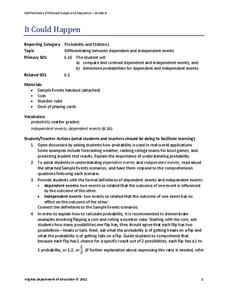
It Could Happen
Understanding of probability will probably increase with the use of a refined resource. Pupils learn to distinguish between dependent and independent events as they calculate the probabilities of these types of events in various...
EngageNY
End-of-Module Assessment Task: Grade 7 Mathematics Module 6
Determine the level of understanding within your classes using a summative assessment. As the final lesson in a 29-part module, the goal is to assess the topics addressed during the unit. Concepts range from linear angle relationships,...
EngageNY
Graphs of Simple Nonlinear Functions
Time to move on to nonlinear functions. Scholars create input/output tables and use these to graph simple nonlinear functions. They calculate rates of change to distinguish between linear and nonlinear functions.
EngageNY
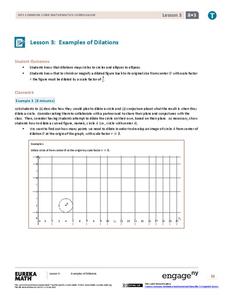
Examples of Dilations
Does it matter how many points to dilate? The resource presents problems of dilating curved figures. Class members find out that not only do they need to dilate several points but the points need to be distributed about the entire curve...
Other popular searches
- Calculator Math Games
- Graphing Calculator and Math
- Non Calculator Math
- Graphing Calculator Math
- Calculator Math Free
- Math Using a Calculator
- Activity Calculator Math
- Calculator Math Percentages
- Calculator Math Fractions
- Calculator Math Lessons
- Calculator Math Word Games
- Math Calculator Activities


