Curated OER
How Fast is it Traveling?
Students calculate the rate of speed of various moving objects within the classroom setting, or outside under a controlled environment.
Curated OER
Interest Rates
Use a KWL chart and discussion to explore the concept behind loans with interest based on percentage rates. Learners examine different types of interest, the history of interest loans and calculate the costs of a loan over a ten-year...
Curated OER
M&Ms Count and Crunch
Students practice skills involving statistics and probability by making predictions on number of each color candy in one pound bag of M&Ms. They record both guesses and actual quantities, calculate percentages, and create bar graphs...
Curated OER
Drawing to Scale
Students examine the process of drawing a picture to scale. They analyze and discuss real-life blueprints for a house, and create a scale drawing of an original invention using calculators and rulers.
Curated OER
Measure for Measure
Young mathematicians work to recognize the relationship between their scale models of the Joides research vessel and the real vessel. They calculate the relationships between various parts of the ship using fractions, ratios, and...
Curated OER
Profitable Soda Stand
Am I making any money? Help learners determine if their fictitious soda stand is turning a profit. They graph linear equations using the slope and y-intercept and identify the best price to use to sell soda. They identify the domain and...
Curated OER
Balanced Forces
Examples and practice questions will help real-life understanding of the Principle of Moments concept. These great slides define the types of levers and pivots, and then give examples of the typical seesaw situations that help the...
Statistics Education Web
When 95% Accurate Isn’t
Investigate the effect of false positives on probability calculation with an activity that asks scholars to collect simulated data generated by a calculator. To finish, participants analyze the probability of certain outcomes which lead...
College at Brockport
Healthy Ecosystems
Is there a connection between the snowshoe hare population and the lynx population? Young scientists will examine this question and graph actual data to determine the relationship between these two species, as well as researching another...
Curated OER
Bird and Dog Race
Your pupil's pet dog and bird are racing down the city streets. In order to know who is going to win, they better know something about calculating rates, the Pythagorean Theorem, and applying those topics to the map of the city.
Illustrative Mathematics
Seven to the What?!?
Sometimes what seems like the easiest problem is really the most difficult. Your class is first going to reach for their calculators, but will realize the number is too large to evaluate. Now what? This is where the fun and the logical...
Illustrative Mathematics
Painting a Barn
When painting a barn you have to calculate surface area, and that is exactly what this resource is about. Not only will your future home owners calculate the surface area, but also the cost. It is a real-life problem that every that...
Curated OER
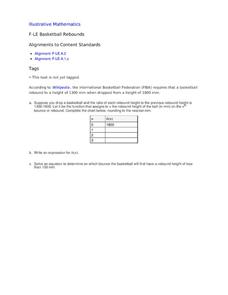
Basketball Rebounds
Your young basketball players will build a table and develop a general formula for a decaying exponential scenario involving the rebound distance of a bouncing ball. Using a CBR and graphing calculator can make this even more hands-on...
BW Walch
Creating and Graphing Exponential Equations
Frequently found in biology and economic application problems, exponential equations show up as stars in this introductory presentation. Taking no background or knowledge of exponentials for granted, the slides walk learners through the...
CK-12 Foundation
Variance of a Data Set
Use variable value sliders to understand variance. The interactive shows four whole numbers, their mean and deviation. Using the information, pupils find the variance of the numbers and respond to question related to the understanding of...
101 Questions
Trashketball
Take a shot using a lesson on volume! Young learners watch a video showing a trashcan filling with paper balls. The task is to calculate the number of paper balls that will fit in the can. Pupils use volume calculations to make a...
Concord Consortium
Rule of 72
Find an easier way to double it. Using the price of an item and the Consumer Price Index, learners determine how long it will be for the price to double. Scholars calculate the length of time it would take for the price to double using a...
Education World
Got the Time? (Math Word Problems)
Upper graders work with peers to solve word problems related to time and independently solve word problems that involve calculating time. They will show their ability to solve and work through mathematical operations. A worksheet is...
Curated OER
Metrically Me!
Students define the parts of a database, search strategies to locate information electronically, create/modify databases, etc. and enter data into a prepared spreadsheet to perform calculations.
Curated OER
Shaquille O'Neal Hand/Foot Span: Student Worksheet
Here's a clever math worksheet that has learners measure their hand span, foot length, come up with a ration, then use that information to figure out the hand span, and foot length of basketball giant Shaquille O'Neal. A good activity!
Texas Instruments
Finding Linear Models Part III
Explore linear functions! In this Algebra I lesson, mathematicians graph data in a scatter plot and use a graphing calculator to find a linear regression and/or a median-median line. They use the model to make predictions.
Curated OER
Parts Per Hundred (ppH)
In this parts per hundred worksheet, students read about describing components of a population by parts per a given number such as 100, 100 or 1 million. Students are given 6 problems to calculate the parts per hundred for each sample...
Alabama Learning Exchange
Polygons-Changing Area Versus Changing Perimeter
Investigate the area and perimeter of polygons in this geometry lesson. Young geometers use grid paper to draw a quadrilateral and calculate its area and perimeter. They also read The Greedy Triangle to identify the changing shape of...
Curated OER
How to Do Long Division
Here is a calculating the quotients worksheet in which learners read the steps to solve and observe the example of a division problem before solving the long division problems with remainders. They solve 12 problems.
Other popular searches
- Calculator Math Games
- Graphing Calculator and Math
- Non Calculator Math
- Graphing Calculator Math
- Calculator Math Free
- Math Using a Calculator
- Activity Calculator Math
- Calculator Math Percentages
- Calculator Math Fractions
- Calculator Math Lessons
- Calculator Math Word Games
- Math Calculator Activities


