Statistics Education Web
The United States of Obesity
Mississippi has both the highest obesity and poverty rate in the US. Does the rest of the data show a correlation between the poverty and obesity rate in a state? Learners tackle this question as they practice their skills of regression....
Statistics Education Web
NFL Quarterback Salaries
Use statistics to decide if NFL quarterbacks earn their salaries! Learners study correlation coefficients after using technology to calculate regression equations. Through the data, they learn the meaning of correlation and correlation...
Mathed Up!
Two Way Tables
When presented with categorical data, a two-way frequency table is a great way to summarize the information. Pupils organize categorical data using a two-way table, then use the tables to determine missing data and to calculate simple...
CK-12 Foundation
Mean: Harmonic Mean
Let the means live in harmony. With lengths representing the values of a small data set, learners compare the arithmetic mean to the harmonic mean. The pupils determine which value is the most accurate representation of the average of...
Shodor Education Foundation
Pythagorean Explorer
Make sure the measurement is right. The interactive provides right triangles with a missing side measurement. Pupils use the given sides and the Pythagorean Theorem to calculate the length of the missing side. After entering the length,...
101 Questions
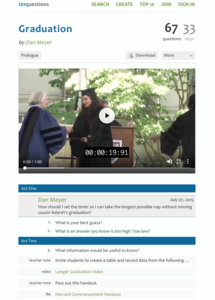
Graduation
Graduation ceremonies are huge milestones, but sometimes waiting for a name to be called gets a bit boring. Scholars find the pace the announcer calls names to determine how long until a specific name is called. Calculations work in...
Concord Consortium
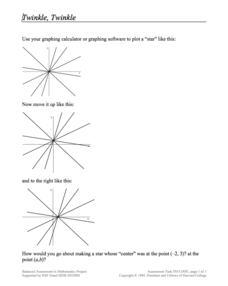
Twinkle, Twinkle
Take a look at a star resource. Young mathematicians use a graphing calculator to draw intersecting lines that look like a star. They then apply translations to move the entire star and also consider what transformations must occur to...
American Statistical Association
Confidence in Salaries in Petroleum Engineering
Just how confident can we be with statistics calculated from a sample? Learners take this into account as they look at data from a sample of petroleum engineer salaries. They analyze the effect sample size has on a margin of error and...
Howard Hughes Medical Institute
Calculating Iridium Fallout from an Asteroid Impact
Should we be afraid of a large asteroid impact on Earth today? Young scientists estimate the size and composition of an asteroid similar to the one that caused the K-T mass extinction. They apply algebraic formulas to answer questions...
Mathed Up!
Surface Area
Surface area is the sum of the parts. Given the measurements of different prisms, pupils determine their surface areas. Individuals find the area of each surface and figure out the surface area by finding the sum. The video, part of a...
California Education Partners
Summer Olympics
Quickly get to the decimal point. The last assessment in a nine-part series requires scholars to work with decimals. Pupils compare the race times of several athletes and calculate how much they have improved over time. During the second...
Concord Consortium
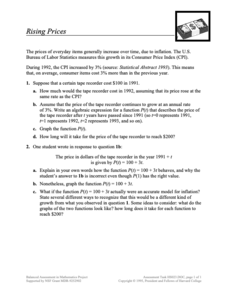
Rising Prices
What will that cost in the future? The scenario provides pupils with a growth as a Consumer Price Index. Learners create functions for a given item to determine future prices and graph them. Class members then compare their functions to...
Curated OER
Triangle Area by OnlineMathLearning.com
In this online math worksheet, students practice finding the area of triangles, given their outside dimensions. When complete, students submit their answers and get instant feedback regarding their accuracy.
Curated OER
Exploring Renewable Energy Through Graphs and Statistics
Ninth graders identify different sources of renewable and nonrenewable energy. For this math lesson, learners calculate their own carbon footprint based on the carbon dioxide they create daily. They use statistics to analyze data on...
EngageNY
Analyzing Residuals (Part 2)
Learn about patterns in residual plots with an informative math lesson. Two examples make connections between the appearance of a residual plot and whether a linear model is the best model apparent. The problem set and exit ticket...
Piscataway Township Schools
Bake Sale
Here is a project that instructs young bakers to calculate the ingredients needed for a cookie bake sale. The catch is that the ingredients for 32 cookies is given; however, pupils must figure out the amounts needed for 12 and 60...
Other popular searches
- Calculator Math Games
- Graphing Calculator and Math
- Non Calculator Math
- Graphing Calculator Math
- Calculator Math Free
- Math Using a Calculator
- Activity Calculator Math
- Calculator Math Percentages
- Calculator Math Fractions
- Calculator Math Lessons
- Calculator Math Word Games
- Math Calculator Activities


