Kenan Fellows
Weight and Balance of an Airplane
A career in aeronautics might be calling your class members. Building from the previous two lessons in the series, learners continue analyzing the mathematics of aeronautics. Groups create a paper airplane using paperclips for balance....
EngageNY
Margin of Error When Estimating a Population Mean (part 1)
We know that sample data varies — it's time to quantify that variability! After calculating a sample mean, pupils calculate the margin of error. They repeat the process with a greater number of sample means and compare the results.
EngageNY
Building Logarithmic Tables
Thank goodness we have calculators to compute logarithms. Pupils use calculators to create logarithmic tables to estimate values and use these tables to discover patterns (properties). The second half of the instructional activity has...
EngageNY
Solving Percent Problems III
What happens when combining percentage discounts? The last instructional activity in a series of 29 introduces the idea of combining discounts one after another. Pupils wrestle with the claim that to find the total discount, they need to...
EngageNY
Events and Venn Diagrams
Time for statistics and learning to overlap! Learners examine Venn Diagrams as a means to organize data. They then use the diagrams to calculate simple and compound probabilities.
Curated OER
Multiplication Mysteries
Arithmetic apprentices practice problem solving and multiplication with a lift-the-flap pair of reproducibles. In this Halloween mathematics lesson, math monsters practice multiplication by making candy corn calculations. They practice...
Curated OER
Systems of Linear Equations
Introduce the inverse matrix method to solve systems of linear equations both algebraically and graphically. Using given data, your class checks their answers with graphing calculators. Handouts are included in this well-thought out lesson.
Curated OER
Deal or No Deal?
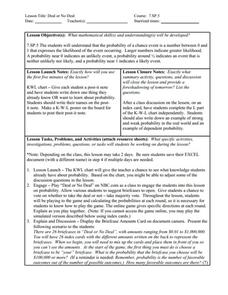
Using a game format, learners engage in an activity called Deal or No Deal. Taking real life scenarios involving items for sale, such as cereal boxes three for $5.00, they determine whether an example is a deal or not. This lesson plan...
EngageNY
Describing the Center of a Distribution Using the Median
Find the point that splits the data. The lesson presents to scholars the definition of the median through a teacher-led discussion. The pupils use data lists and dot plots to determine the median in sets with even and odd number of data...
Beyond Benign
Ecological Footprint
How does your lifestyle measure up in terms of your ecological footprint? Young ecologists examine their impact on the planet using an insightful online calculator. A short quiz asks users to rank the size of their homes, their energy...
Royal Society of Chemistry
Gimli Glider—Anecdotes for Chemistry Teachers
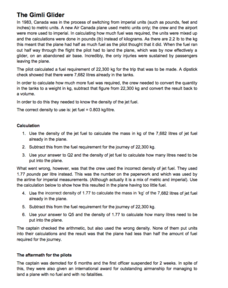
What's the moral of this story? Units save lives! Teach measurement conversion through storytelling in a quick math-based lesson. Young scientists learn how one country's decision to swap from imperial to metric standard units caused an...
Berkshire Museum
Adopt a Schoolyard Tree
Help young scientists connect with nature and learn about trees with a fun life science lesson. Heading out into the school yard, children choose a tree to adopt, taking measurements, writing descriptions, and drawing sketches of it in...
EngageNY
Dividing Fractions and Mixed Numbers
Class members discover how to extend division to fractions to mixed numbers. Individuals first review how to convert mixed numbers to improper fractions and then apply division strategies learned in previous lessons. A memory game tests...
EngageNY
Describing Variability Using the Interquartile Range (IQR)
The 13th lesson in a unit of 22 introduces the concept of the interquartile range (IQR). Class members learn to determine the interquartile range, interpret within the context of the data, and finish by finding the IQR using an exclusive...
EngageNY
Measuring Variability for Skewed Distributions (Interquartile Range)
Should the standard deviation be used for all distributions? Pupils know that the median is a better description of the center for skewed distributions; therefore, they will need a variability measure about the median for those...
EngageNY
Translating Graphs of Functions
If you know one, you know them all! Parent functions all handle translations the same. This lesson examines the quadratic, absolute value, and square root functions. Pupils discover the similarities in the behavior of the graphs when...
EngageNY
Using Expected Values to Compare Strategies
Discover how mathematics can be useful in comparing strategies. Scholars develop probability distributions for situations and calculate expected value. They use their results to identify the best strategy for the situation.
Curated OER
How Much Does it Cost to Light Your School?
Learners compute the cost of electricity used to light their classroom and their school for various lengths of time. They compute the amount of coal needed to produce the electricity used for one hour of light in their classroom. An...
Beacon Learning Center
Bowling Over the Order of Operations
Upper graders will solve equations using order of operations, and create equations that to play a fun math bowling game. They will bowl using dice to practice operations. Extensions are also included.
Curated OER
Graphing Systems of Inequalities
Solve equations and graph systems of inequalities. Designed as a lesson plan to reinforce these concepts, learners revisit shading and boundaries along with solving linear inequalities.
Science Geek
The Mole
What can you call a tooth in a glass of water? A one-molar solution! Presentation covers moles, Avogadro's Number, calculating formula mass, converting moles to grams, converting grams to moles, and calculations with moles. It is the...
Teach Engineering
Watt Meters to Measure Energy Consumption
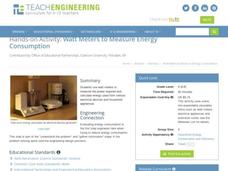
It used watt amount of energy? This resource investigates the power usage of small household appliances. Using a watt meter, groups measure the actual wattage used by an appliance and then calculate the energy used daily.
EngageNY
Chance Experiments, Sample Spaces, and Events
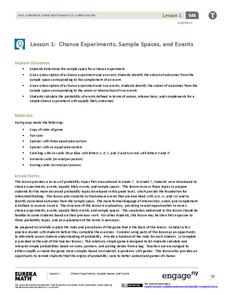
Want a leg up on the competition? Show classes how to use mathematics to their advantage when playing games. Learners calculate probabilities to determine a reasonable scoring strategy for a game.
EngageNY
Euler’s Number, e
Scholars model the height of water in a container with an exponential function and apply average rates of change to this function. The main attraction of the activity is the discovery of Euler's number.


