Saxon
Plotting Functions
Youngsters use a graphing calculator to assist in creating a function table. They graph the function on a coordinate plane. They explore the relationship between the domain and range in the graph. This four-page instructional activity...
Curated OER
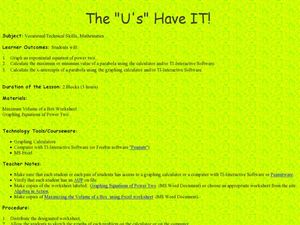
The "U's" Have IT!
Students explore the maximum and minimum values of parabola. In this exponential equations instructional activity, students use graphing calculators or TI Interactive Software to calculate values of parabola and graph x-intercepts of...
Curated OER
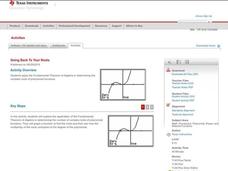
Going Back to Your Roots
Who doesn't need to know the Fundamental Theorem of Algebra? Use the theorem to find the roots of a polynomial on a TI calculator. The class explores polynomials with one solution, no real solutions, and two solutions. This less...
Curated OER
Exponent Rules
Pupils use calculators to work independently to discover the rules for working with exponents. The lesson requires the use of a TI-nspire handheld and software.
Curated OER
Area of Circles and Probability
Young scholars investigate the area of squares and circles. In this geometry lesson, students calculate the area and probability of simple events. They work on a laptop using Safari.
Curated OER
Making Connections: Matrices, Graph, Linear Systems
In this set of activities, matrices and equations are explored. They work with matrices using pen and paper as well as graphing calculator. Additionally real-world problems are explored.
Education World
Investigating Volume
Explore the concept of volume using unit cubes. Working individually or in small groups, your class measures with a ruler in inches and calculates the volume of various rectangular household boxes (provided by the teacher) and completes...
Curated OER
The Candy Color Caper
Students explore the concept of probability. They calculate the probability of an event happening and graph their results. Students determine the probability of winning a sweepstakes. They construct a bar graph to represent all the...
Alabama Learning Exchange
Jump! An Exploration into Parametric Equations
Explore parametric equations in this lesson, and learn how to determine how much time it takes for an object to fall compared with an object being launched. high scoolers will use parametric equations to follow the path of objects in...
Curated OER
Complex Numbers
The class practices, on paper and/or on a TI graphing calculator the concepts of how to add, multiply, divide and subtract complex numbers using the correct property.
Curated OER
Cutting Costs With Coupons.
Learners clip coupons for food items, create a menu using those items, and add up the total savings. They correctly calculate the total amount of money that would be saved if they used the coupons.
Curated OER
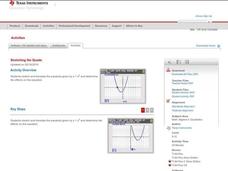
Stretching the Quads
Explore parabolas in this algebra lesson with the graphing calculator. The class investigates what effects the changing of the parameters of the vertex form of a quadrati have to its graph. They find the zeros of a quadratic graphically...
EngageNY
Piecewise and Step Functions in Context
Looking for an application for step functions? This activity uses real data to examine piecewise step functions. Groups create a list of data from varying scenarios and create a model to use to make recommendations to increase revenue.
EngageNY
Modeling with Quadratic Functions (part 1)
Relevance is key! The resource applies quadratic modeling by incorporating application of physics and business. Pupils work through scenarios of projectile motion and revenue/profit relationships. By using the key features of the graph,...
EngageNY
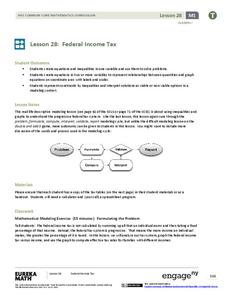
Federal Income Tax
Introduce your class to the federal tax system through an algebraic lens. This resource asks pupils to examine the variable structure of the tax system based on income. Young accountants use equations, expressions, and inequalities to...
National Research Center for Career and Technical Education
Photoshop Scale
Say cheese! Can your class take a great photo and size it to fit any need? A career and technology-centered lesson plan demonstrates the correct way to resize images in Adobe Photoshop. Scholars view a presentation and work individually...
Curated OER
Bouncing Ball
High schoolers collect height versus time data of a bouncing ball using the CBR 2™ data collection device. Using a quadratic equation they graph scatter plots, graph and interpret a quadratic function, apply the vertex form of a...
Curated OER
Similarity and Dilations - Discover Properties of Similar Figures
Learners investigate properties of similar figures. In this properties of similar figures activity, pupils construct similar figures using Cabri Jr. They dilate their figure to create a similar one, and discuss the relationships between...
Curated OER
Visualizing Vectors
Investigate vectors in standard positions and use the CellSheet application on the TI calculator to find the sum of two vectors. Convert from polar to rectangular coordinates and vice versa, and show graphs of the vectors.
Curated OER
Watch Your P's and Q's
Using your graphing calculator, find all the rational zeroes of a polynomials by using the Rational Zero Theorem. Divide polynomials using the Remainder Theorem and the Factor Theorem and then graph it to find the number of real roots.
Curated OER
Forms of Quadratic Equations
Transformations of parabolas to fit a particular quadratic equation is taught through this lesson. In this transforming parabolas to fit a particular quadratic equation lesson, students describe the transformations of the parabola...
Curated OER
The Internet Pizza Server - Pizza Simulation
Students simulate going to a pizza restaurant, ordering a pizza, and determining whether a small, medium, large, or family size pizza is a "better-buy." Students calculate the price/per/topping and determine whether this price is "fair"
Curated OER
Exploring Expressions
Examine parts of an expression in this algebra lesson. Ninth graders identify the properties of the coefficient and their behavior to the graph. They graph the equation on a TI to see their results.
Texas Instruments
Graphs of Rational Functions
Take your kids on a tour of graphing rational functions. Using this TI lesson, high schoolers identify the end behavior of their functions. They find the domain and range, describe end behavior, and look at asymptotes and restrictions of...


