Curated OER
Walk-A-Thon
Students graph linear http://www.lessonplanet.com/review?id=180542equations. In this problem solving lesson, students calculate slope and plot ordered pairs on a coordinate grid. Using a real-life example of a walk-a-thon, students...
Curated OER
How Far Is It?
Students use a map key to estimate the distance from Salt Lake City, Utah, to ten other cities. Then they use an online distance calculator to see how close their estimates come!
Curated OER
Measurement: Finding Areas of Rectangles
Gardening geometers construct the formula for the area of a rectangle by viewing a video revolving around two young people, their lawn mowing business, and their need to charge by the square meter. A relevant real-life application lesson!
Curated OER
Shot Put Arc
Learners complete Part A: Dissecting a Circle. They generate their own chords within the circle. Students measure the various parts of the arc in the shot put pit. The first two measurements, the chord and distance from the midpoint of...
Curated OER
Graphing Linear Equations on the TI-73
Eighth graders work in pairs with a TI-73 graphing calculator to complete a multiple-choice review using the Classroom Performance System. Each team uses a remote unit to "click in" the answers. When all teams have completed the review,...
Curated OER
Measurement and Algebraic Thinking
Comparatively speaking, does a bug travel farther than a human in 10 seconds? Get a bug and measure how far it travels in 10 seconds. Have a human team member run for 10 seconds and calculate the distance ran. Answer the question,"Who...
Alabama Learning Exchange
Comparing Fuel Economy
Compute fuel economy and gas mileage. Why? So you can teach rates and ratios, of course! Middle schoolers calculate the rate of miles per gallon for various vehicles. They research each vehicle, its mileage per gallon, and cost per...
Utah Education Network (UEN)
Linear Graphs Using Proportions and Rates
Using a TI-73 or other similar graphing calculator middle school math majors investigate the linear relationship of equivalent proportions. After a brief introduction by the teacher, class members participate in a timed pair share...
Curated OER
How Many Frogs?
Students explore the concept of linear regression. For this linear regression lesson, students find the line of best fit for a set of data pertaining to a frog population. Students use their line of best fit to predict the frog...
Curated OER
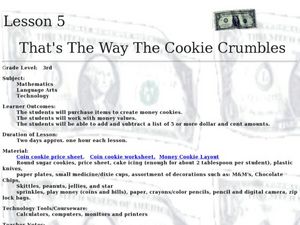
That's The Way the Cookie Crumbles
Third graders work with money values and making purchases. In this money instructional activity, 3rd graders listen to Donna Guthrie's book, Real World Math: Money and Other Numbers In Your Life. They make money cookies either with a...
Curated OER
Graphing Exponentials
Bring your Algebra class to the computer lab! Using materials created by Texas Instruments, they explore exponentiasl and graphs. Be sure to download the correct materials (on the right side of the webpage) before having them walk...
Curated OER
Matrix Madness!!
Perform operations to add, subtract, multiply and divide matrices. Then solve problems with vectors using matrices. A three day lesson: Matrix Madness, Mystical Matrices, and Decode the Encode. The last lesson has prizes that the class...
Curated OER
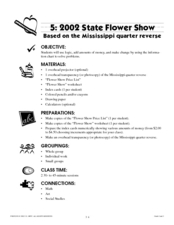
2002 State Flower Show
Here is another State Quarter lesson. This one uses the Mississippi State Quarter. Pupils utilize beautifully-designed worksheets embedded in the plan, to practice calculating which combinations of flowers they can afford to buy. They...
Curated OER
How Long Can You Go?
Eighth graders examine the usefulness of a line of best fit by collecting and graphing data, using a graphing calculator to determine the line of best fit, and making a variety of predictions. They watch a video, then design a...
Curated OER
Geometry: Translations and Reflections
Group work and participation is used to perform a specified translation or reflection. In this geometrical translation lesson, small groups of pupils are each given a shape to plot on a coordinate grid. Each shape is then translated or...
Curated OER
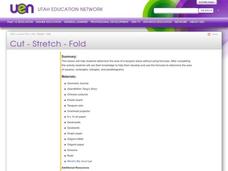
Area of Tangram Pieces
Mathematicians calculate the area of a tangram piece without using formulas. They use a geometry journal to record activities during this lesson. They make a set of tangrams and use them to compute area. They use what they discover to...
Curated OER
Super Size It, Please!
Pupils take photos from a given distance and determine the height of the person using a scale factor. Pupils calculate the ratio of student actual height to student photo height. They take pictures from 3 different distances to see if...
Curated OER
Operating on Matrices
Learners investigate matrices by exploring addition, subtraction and multiplication of matrices. Students find the determinant and inverse of a matrix. The lesson includes a set of practice problems
Curated OER
Proof of Identity
Learners explore trigonometric identities. In this Algebra II lesson plan, students use graphing to verify the reciprocal identities. Using Cabri Jr, learners investigate the Pythagorean trigonometric identities and the geometric c...
Curated OER
Another Way of Factoring
Focusing on this algebra activity, learners relate quadratic equations in factored form to their solutions and their graph from a number of different aspects. In some problems, one starts with the original equation and finds the...
Curated OER
Guess-timating Fun
Learners estimate the number of items in a jar and write their estimate boldly on a piece of paper. They line up holding their numbers. Then, they calculate the median, mean, mode and average of the guesses.
Curated OER
How Big is Barbie?
Students measure various dimensions of a male and a female dolls body and scale them proportionally to average human measurements. They calculate the appropriate scale factor (magnitude) to enlarge their doll and apply that scale factor...
Curated OER
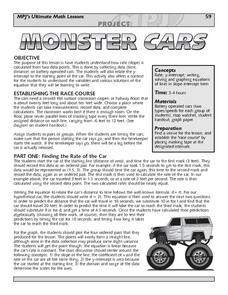
Monster Cars: Slope
Students examine how a rate is calculated from two points. Using battery operated cars, pairs of students measure time and distance. Afterward, they use this data to calculate the rate. Students then plot four ordered pairs and discover...
Alabama Learning Exchange
Polygons-Changing Area Versus Changing Perimeter
Investigate the area and perimeter of polygons in this geometry lesson. Young geometers use grid paper to draw a quadrilateral and calculate its area and perimeter. They also read The Greedy Triangle to identify the changing shape of...


