Curated OER
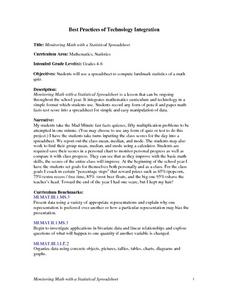
Monitoring Math with a Statistical Spreadsheet
Students use a spreadsheet to compute landmark statistics of a math
quiz. This instructional activity can be ongoing throughout the school year and it integrates mathematics curriculum and technology in a simple format for student use.
Curated OER
The Demographics of Immigration: Using United States Census Data
High schoolers work together to analyze United States Census data on immigration. They compare and contrast the data and determine how immigration numbers have changed over time. They calculate percentages and make their own...
Curated OER
Shopping for Savings
Fourth graders calculate savings and identify the best value items from a list of products. They rotate through five studying stations, completing various math activities involving calculators and solving problems related to shopping...
Curated OER
Profit and Loss
Students analyze the concept of profit and loss, the components of a simple profit and loss statement and the importance of a profit and loss statement. They calculate profits using gross income, total expenses and cost of goods sold....
Curated OER
M&Ms; Line Plots and Graphing
Students, using small individual bags of M&Ms, engage in activities including; estimating, sorting, graphing, mean, median, mode, fractions, percentage, and averaging.
Curated OER
Circle Graphs and Percents
For this circle graph and percentages worksheet, learners fill in a chart, write percentages, calculate discounts, and more. Students complete 4 sets of problems.
Curated OER
A Fraction of the Possibilities
Students review the conversion of fractions to decimals, develop strategies to compare fractions perform complex calculations using ratio techniques similar to the construction of fractions.
Curated OER
Compound Interest
In this compound interest worksheet, students solve 3 problems after reading about compound interest. They determine the cost of the Apollo missions, they calculate inflation and the cost it would be to send man to the moon today and...
Curated OER
Ratio Basketball
Learners, in teams of four, practice shooting free throws while mentally converting the ratio of shots made to those thrown into a percent. They chart and record the ratio, decimal and actual percentage earned after each round.
Curated OER
The Discount Is Right
Young scholars estimate and calculate the sale price of five items using the original price and a designated rate of discount. They use percent to calculate the rate of discount and the original.
Curated OER
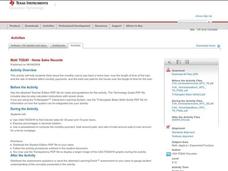
Home Sales Records
Teach your class how to calculate monthly payments on a home mortgage. In this percent lesson, students calculate the monthly payment on a home mortgage, and compare different lengths of time and the interest rates for national median...
Curated OER
Baseball Relationships - Using Scatter Plots
Young scholars use graphing calculators to create scatter plots of given baseball data. They also determine percentages and ratios, slope, y-intercepts, etc. all using baseball data and statistics.
Curated OER
Epidemic Proportions
Students research epidemics that have devastated world population at various points in history. They share and calculate statistics obtained in their research and develop graphs comparing and contrasting how different epidemics affect...
Curated OER
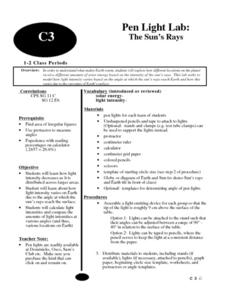
Pen Light Lab
Students study what makes Earth warm and explore how different locations on the planetreceive different amounts of solar energy based on the intensity of the sun's rays. They calculate light intensities and compare the
amounts of light...
Curated OER
Seeing a Dwarf Planet Clearly: Pluto
In this dwarf planet activity, students use images from the Hubble Space Telescope and they determine the scale of the image, they identify the largest features in the images, they calculate the volume of Pluto and they create a model of...
Curated OER
Government Goods and Services
Fifth graders investigate the connection between taxes and government services. In this economics instructional activity, 5th graders discuss the process and benefits of paying sales and income taxes. Using calculators,...
Curated OER
Inflation: Taking Prices Higher
Students examine the definition of inflation and its impact through history. They read and discuss online text, discuss examples of inflation, calculate the prices of various items for different years using an inflation rate of 3%, and...
Curated OER
Probability and Geometry
Learners examine the relationship between probability and geometry to solve problems. In this geometry and probability lesson, students investigate the effect of changing percentages on a spinner to the probability of landing on a...
Curated OER
Fashion Sense and Dollar Wise
Middle schoolers work in groups to show understanding of the relationship between fractions, decimals, percentages, and the application of ratios and proportions. In this decimals, fractions, and percents lesson, students use real life...
Curated OER
Fashion Sense and Dollar Wise
Students find the cost of an outfit. In this percentages lesson, students look at ads, pick out an outfit, and find the sale price. They create a commercial and complete 4 included worksheets.
Curated OER
Calculating Interest
Students solve interest problems for bank accounts and loans to gain real life experience. They also review newspapers and find a car they wish to purchase then are given a rate and time of loan.
Federal Reserve Bank
So How Much Are You Really Paying for that Loan?
Loans are rarely provided without a cost. Pupils evaluate the high cost of using a payday loan or payday advance through discussion and worksheets, and finally work in groups to develop short public service announcements...
Curated OER
Closing the Salary Gap
Young scholars explore careers in their community and compare the average salaries for men and women working in those careers. They explore a variety of careers available in their community through participating in this lesson.
Curated OER
Determining the Existence of Gender Bias in Daily Tasks
Help your kids explore gender bias. Learners design and conduct a survey examining role responsibilities within families. They determine the percentage of responsibilities for males vs. females and graph the results. Then they analyze...


