Curated OER
Kansas vs the U.S.
Students demonstrate an understanding of the physical and political geography of Kansas. They view maps and films to gain knowledge of Kansas. They calculate the percentage Kansas harvests for each crop out of the national total.
Mathalicious
Three Shots
To foul or not to foul, that is the basketball question. High schoolers look at the probability that fouling out a player and allowing free throws yields a better outcome than allowing the original shot. The resource provides a...
Curated OER
Accidents Happen: Seat Belt Laws, Enforcement, and Usage
Start with a NOVA video about car crashes, crash test dummy footage, or other video about seat belt use. Or have groups review attached data about seat belt usage (by state) and share their conclusions. Learners then devise a method to...
Curated OER
Voter Turnout
Explore politics by analyzing the voting process. Pupils discuss the purpose of casting votes in an election, then examine graphs based on the data from a previously held election's turnout. The lesson concludes as they answer study...
Curated OER
The Minority Majority
Students design a census class and school, then tabulate the results. They respond to a sample census, then reflect on why questions of race and national origin are different.
Curated OER
The Winning Edge: Probability in Basketball: Lesson 2
Students calculate the probability of a desired outcome based upon a statistically significant number of discrete events (i.e. endgame free-throw attempts). They participate in an online simulation of basketball free throws.
Curated OER
Getting Percentible
This unit explores the connections between percentages, decimals, and fractions. It focuses on strategies for solving problems involving percentages and applies these strategies to real life contexts.
Curated OER
Percent Box
Learners examine the procedures to determine a number when the percentage of the whole is known or to find the whole number when the part or percentage is known.
Curated OER
Percent of change
In this percent of change worksheet, learners figure out the percent of money amount if something is on sale and it is a certain percentage of the price. Students solve 9 problems.
Curated OER
Introduction to Earning Interest: What are APR and APY?
Students explore saving and investing money. In this middle school personal finance lesson, students define and use investment vocabulary, explore compound interest and its effect of savings, and compute simple and compound...
Curated OER
Finding Percent When Given A Fraction
Seventh graders calculate percentages when given a fraction. They convert a percentage to a fraction. All of this be done by each student's ability to read the graphs made available by the spreadsheet information.
Curated OER
Store Wide Sale
Students practice figuring percentages by solving written shopping problems. In this consumer math lesson plan, students read several scenarios dealing with items on sale and must figure out the new price. Students check...
Curated OER
Wise Shoppers
Students complete several activities to learn about currency and the functions of money. In this money functions instructional activity, students complete activities to learn what are the functions of money. Students calculate item...
Curated OER
Percent of a Number
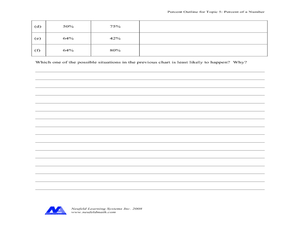
In this percent worksheet, learners complete problems such as changing percents to decimals, filling in percentage charts, and more. Students complete 8 problems.
Curated OER
Standard Deviation
Students find city temperatures and analyze their means to find the standard deviation. They calculate the standard deviation of monthly temperature means.
Curated OER
Book: Latinos Today: Facts and Figures
Students, after reading Chapter 1 in the book, "Latinos Today: Facts and Figures," identify and characterize the four main ethnic/racial groups in America. They calculate and design a bar graph showing their populations by their...
Curated OER
Taste the Rainbow
Middle schoolers practice estimating and graphing by utilizing Skittles. In this statistics lesson, students complete worksheets based on the likelihood of a certain color of skittle coming out of the bag. Middle schoolers...
Curated OER
Probability
In this probability worksheet, 8th graders solve 10 different problems that include determining a probability of events as a percentage. First, they determine the probability that a marble drawn will be green. Then, students determine a...
Curated OER
A Statistical Look at Jewish History.
Eighth graders study the relationship between fractions, decimals and percentages by completing activities. In this research analysis lesson, 8th graders look at different websites to figure out Jewish populations in different situations.
Helping with Math
Ratio and Proportion: Rates
Unit rates are introduced to your math minors on this printable worksheet, complete with answers. There are only three problems: the first involves biking speeds, the second the cost of bracelets, and the third the cost of apples....
Curated OER
Introduction to Measuring the Forest
Students investigate how much wood is in a forest. In this forestry lesson, students calculate how much usable wood comes from the forest. They will read, Sizing Things Up from Trees + Me = Forestry, measure firewood piles, and create a...
Curated OER
Comparing Earth and Mars
Students work together to compare and contrast Mars and Earth. Using the internet, they answer questions given to them by their teacher and calculate answers showing their work. They graph their answers and discuss the results of the...
Curated OER
Shopping Spree
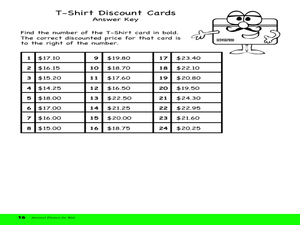
Students calculate discounts, sale price, and sale tax. In this consumer math lesson plan, students visit mock stores which have items for sale. Students calculate the final prices of items.
Curated OER
Ratio, Percent, & Proportions
Seventh graders explore the concept of percents, ratios, and proportions. In this percents, ratios, and proportion lesson, 7th graders have 237 ounces of beads to weigh. Students work in groups to weigh the beads in a way so that each...


