Curated OER
Wildlife Management
Students examine the effects of various management strategies on the size of wildlife populations. Each student simulates the management of an animal population in a card game, graphs the results of the wildlife game, and participate in...
Curated OER
Probability of a Single Event
In this probability worksheet, students solve thirty-six fractional probabilities involving the rolling of a dice to specific scenarios, game spinners, sweets in a bag and random colors. Students check their answers online as they go.
Curated OER
Measuring the Earth (Eratoshenes' method)
Sixth graders engage in problem solving, communicating, reasoning, and connecting to represent and solve problems, using geometric models.
Curated OER
Pollution Assessment: Is Wood Lake a Good Lake?
Students become aware of pollution in Richfield Minnesota's Wood Lake, identify sources of pollution in Wood Lake, learn to use variables, equations, spreadsheets and modeling software, and generate solutions for the problem.
Curated OER
EBT-rimental
Students engage in a lesson that gives them the tools needed to become knowledgeable credit consumers. The companion website for the ITV program TV-411 is used to provide learners with an interactive experience of what credit has to offer.
Curated OER
Length Lotto-Teacher's Notes
Students convert metric units of length, specifically meters, centimeters, and millimeters. For this lesson of converting measurements, students participate in various games which require them to put the measurements in order or convert...
Curated OER
The World is a Village
Students observe Americans through the eyes of the world. In this human population lesson, students utilize the Internet to view the World Pop Clock and follow the world's population by the minute. Students predict what the...
Curated OER
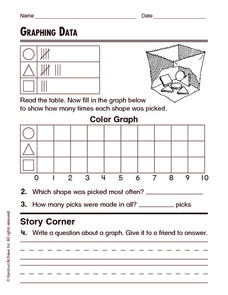
Graphing Data
In this graphing data worksheet, students solve and complete 8 different word problems related to graphing data given. First, they determine the percent of people who do not believe in any of the phenomena described and explain. Then,...
Curated OER
Find the Mystery Lines...If You Can!
In this atomic spectral lines worksheet, students observe a diagram of the spectral lines, their different wavelengths and their intensity. They solve 4 problems which include interpreting the scale, matching up tabulated lines with the...
Curated OER
Do Fast CMEs Produce Intense SPEs?
In this coronal mass ejections and Solar Proton Events worksheet, students create a Venn Diagram to represent given data. They answer 5 questions about the data related to the number of coronal mass ejections and Solar Proton Events...
Curated OER
Graphing Surveys and Analyzing Data
Young scholars analyze data and graph the results of their surveys. In this statistics lesson plan, students create graphs using excel to make graphs to be able to better observe their data. They conclude how great we as unique individuals.
Curated OER
Pre-calculus Unit 3 Test 2
Students will solve exponential function problems, graph exponential functions, find the value of logarithms, determine future value, and compound interest. In this Pre-calculus lesson, students will use the properties of logs to solve...
Curated OER
Iditarod-Statistics and Rates
Students analyze data from the Iditarod race. In this data analysis lesson, students work in pairs to analyze data and answer several questions such as, "what is the difference in the rate of travel" and "how much more prize money does...
Curated OER
Assessing Normalcy
Students define normal distribution as it relates to the bell curve. In this statistics lesson, students use the central tendencies of mean, median and mode to solve problems. They plot their data and draw conclusion from the graphs.
Curated OER
Different Perspectives of Oregon's Forest Economic Geography
Learners map data on employment in wood products manufacturing in Oregon counties. In this Oregon forest lesson, students discover the percentage of people employed in the forest manufacturing industry. Learners create a box and whisker...
Curated OER
Scientific Observation of Force and Acceleration on an Object
In this force and acceleration worksheet, 8th graders answer ten questions based on two graphs. The first graph is a scatter plot, the second is a line graph.
Curated OER
Metrics
Students discover the need for a universal measurement system. They practice using basic metric units in measuring distance and weight.
Curated OER
Census Statistics and Graphing
Students graphically represent data from the Census. In this middle school mathematics instructional activity, students investigate the housing characteristics of different tribes of Native Americans and compare them to the average...
Curated OER
Budget Finances
Learners role play the role of a recent graduate of high school living on their own. Using play money, they are given one month's salary and they discover they own their own house or apartment and owe money on a car loan. They develop...
Curated OER
Using Standard Deviation, part 2
Pupils explain and learn the practical application of standard deviation. They compare cities in the U.S. and discover whether cities closer to the ocean have more consistent temperatures. Useful resources are given.
Curated OER
What's a Per-"cent"?
Learners recognize the mathematical connections between fractions and percents. They develop and study graphs to make connections between their data and what it represents. They write about the connections they have discovered.
Helping with Math
Ratio and Proportion: Writing Ratios (1 of 2)
Here is the first of two printable ratio worksheets. For the first three problems, pupils count the numbers of two different objects and simply write down the ratios. There are then four problems in word form for which they also write...
Curated OER
Ratio and Proportion: Proportional Ratios
In this ratios worksheet, students write yes or no for if the ratios given are proportional or not. Students complete 7 number problems and 5 money problems.
Curated OER
Lyrics Statistics
Students describe, analyze and generalize relationships, patterns, functions using words. symbols, variables, tables and graphs.


