Curated OER
Charts and Graphs
Fifth graders interpret data into graphs and percentages. In this organizing data lesson, 5th graders discuss bar, circle and line graphs. Students complete bar graph and apply probability using the results.
Curated OER
Finding the Area Under A Curve with Random Probability
Students explore the concept of area under a curve. In this area under a curve lesson, students find the area under a curve using the Monte Carlo method using random points and probability. Students calculate the area under the same...
Curated OER
Leveled Problem Solving: Circle Graphs
In this circle graphs learning exercise, students solve 6 word problems based on a circle graph about the most popular classes for sixth graders. Students calculate angle measures of circles for 2 of the problems.
Curated OER
Computing Costs
Seventh graders calculate the out-of-pocket money needed to purchase a discounted item taxed at a certain percentage of sales tax.
Curated OER
Making Blood!
students research blood's components, and use their math skills to recreate a model of whole blood using commonly found food items.
Curated OER
Percent Worksheet 16
In this percentages practice activity, students use their math skills to solve 18 problems that require them to calculate the percentages of whole numbers.
Curated OER
Percent Worksheet 26
In this percentages practice worksheet, students use their math skills to solve 18 problems that require them to calculate the percentages of whole numbers.
Curated OER
Skittles Lab
Pupils use Skittles as manipulatives to practice computing decimals from fractions, computing decimals into percentages, and creating bar graphs from gathered data.
Curated OER
Percent in Business
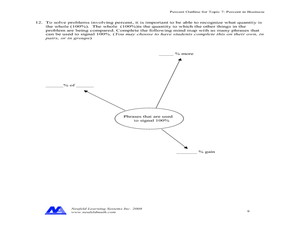
In this percentages worksheet, students solve word problems that include percentages in business. Students complete 14 word problems.
Curated OER
Batting the Unknown
Students use batting averages to provide a measure of a player's past success. They use Algebra to calculate required performance to improve the average. Students compare baseball batting statistics early in the season and late in the...
Curated OER
Honey Bunches of Oats
Students explore a variety of crops that are used in our food products utalizing a box of the cereal, Honey "Bunches of Oates." Percentages of each of the three different kinds of flakes present are calculated.
Math Worksheets Land
Patterns of Association (Using Data Tables) - Step-by-Step Lesson
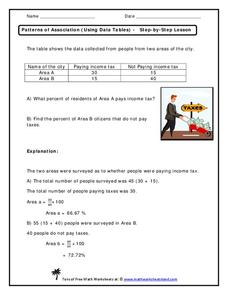
This worksheet belongs to a four-part resource that gathers information from data tables to calculate percentages. The page introduces one problem and shares an explanation to the answer.
Willow Tree
Percent of Change
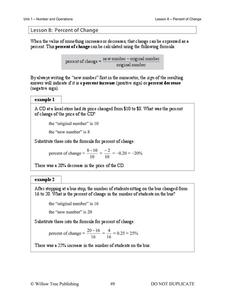
Your car decreases in value from $20,000 to $17,000. What percent of the value have you lost? Pupils answer word problems by determining the percent of change.
Curated OER
Skittle Around with Fraction and Percentages
Fifth graders investigate the interchangeable relationship betweeen fractions and percents. They discuss the concepts using teacher provided questions. Then sutdents work in cooperative groups to maximize scaffolding.
Curated OER
Shopping: 10% Off (English Pence)
For this discounts worksheet, students study pictures of fruits and vegetables with prices marked in English pence. Students calculate the new price with 10% off.
Curated OER
Nutrients by the Numbers
Students read and discuss an article on the amount of sugar in various food products. They compare the nutritional values of food products, calculate their daily intake of nutrients, analyze serving sizes, and compare/contrast their own...
Curated OER
Effective Use of Living Space
Young scholars explore the concept of scale. In this scale lesson, students create a scale model of a room. Young scholars calculate the area of a room. Students determine what percentage of the room is occupied by furniture.
Curated OER
Percent
For this percent worksheet, students calculate the percent of each number. Students calculate percentages of 10 numbers and write the answers with decimals.
Curated OER
Problem-Solving Application: Make a Circle Graph
In this circle graphs instructional activity, students analyze a data table about the activities in a day. Students then use this data to make a circle graph. Students answer 6 questions about the graph.
Curated OER
Percent
In this percent worksheet, students express fractions as percentages. Students complete 10 problems where they calculate fractions as percentages.
Curated OER
Percent
In this percent worksheet, students express fractions containing one and two digit numbers as percentages. Students complete 10 problems where they calculate fractions as percentages.
Curated OER
Roundball for Remembrance
Students view a segment of Futures With Jaime Escalante showing the application of math in basketball, and they try to find some of these applications in a tape of a game played by their home school. This fun lesson should be very...
Curated OER
Percentages
In this online math activity, students practice converting from decimals to percents. When complete, students submit their answers and get instant feedback regarding their accuracy.
Curated OER
Topics in Math
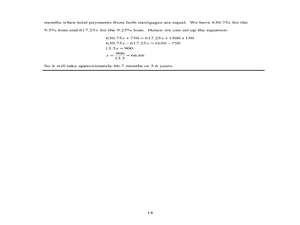
In this consumer mathematics worksheet, students explore a variety of topics in mathematics including simple interest, perimeter, area, volume, translating words into symbols, percentage problems and mortgage calculations. The fourteen...


