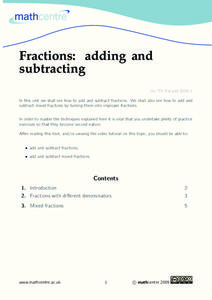
Math Centre
Fractions: Adding and Subtracting
Young mathematicians piece together the puzzle of fractions. Starting with the addition and subtraction of fractions with like denominators, this series of example problems and skills practice exercises transitions students to working...
EngageNY
Computing Actual Lengths from a Scale Drawing
The original drawing is eight units — how big is the scale drawing? Classmates determine the scale percent between a scale drawing and an object to calculate the length of a portion of the object. They use the percent equation to find...
Curated OER
Study Buddies: Estimating Quotients
In this math worksheet, young scholars will work with a coach to solve a division problems by estimating quotients. Students will follow a step-by-step process and notes are provided for the coach.
Curated OER
Probability Experiment Simulation: Design and Data Analysis Using a Graphing Calculator
Seventh graders simulate probability experiments. Using a graphing calculator, 7th graders design, conduct, and draw conclusions from simulations or probability experiments. Students construct frequency tables and compare the...
Curated OER
Calculate Percentages
Sixth and seventh graders study the concept of finding the percent of a number. They calculate the percent of any given number. Pupils describe ways to use calculating percents in their daily life, and change percents into decimals,...
Curated OER
A Statistical Study of the Letters of the Alphabet
Students gather appropriate information for simple statistical analysis. Then they will calculate probability working with a piece of literature that makes this lesson ideal for teaching across the whole curriculum.
Curated OER
Calculators
Students investigate the four basic operations of mathematics that are addition, subtraction, multiplication, and division. The use of a technology game is part of the lesson. They demonstrate the proper use of a calculator as part of...
Curated OER
Feasibility Study For a New Business
For this business worksheet, students write out a research study looking at the potential for a new business or the profits of an existing one.
Curated OER
Geography of South America
Student's identify geographic features of a South American map. They use the scale of the map to calculate distances between points. They identify examples of the five geographic themes on the map of South America.
Curated OER
Decimal Calculator Numbers
Fourth graders practice working out a hidden number on a calculator by utilizing number sequence in the advanced multiplicative stage seven. They enter a number into their calculator and push the division sign once and go from there.
Curated OER
Using Calculators And Spreadsheets
Students discuss the advantages of using calculators and spreadsheets in balancing checkbooks. They also identify the pros and cons of using these tools in adult education classrooms.
Baylor College
Your Energy Needs (BMR)
How many Calories one needs on a daily basis is dependent on a number of factors including gender, height, and activity level. In the third of seven lessons about energy and food, young nutritionists calculate the number of Calories...
Teach Engineering
Graphing Equations on the Cartesian Plane: Slope
Slopes are not just for skiing. Instructors introduce class members to the concept of slope and teach them how to calculate the slope from a graph or from points. The lesson also includes the discussion of slopes of parallel and...
US Department of Commerce
Applying Correlation Coefficients - Educational Attainment and Unemployment
Correlate education with unemployment rates. Individuals compare state and regional unemployment rates with education levels by calculating the correlation coefficient and analyzing scatter plots. Pupils begin by looking at regional data...
Baylor College
Calculating Exponential Growth
There can be a steep learning curve when teaching about exponential growth, but the lesson helps kids make sense out of the concept. When talking about exponential growth of viruses, learners may not be very interested, but when you are...
Chemistry Collective
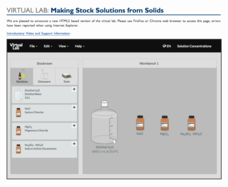
Virtual Lab: Making Stock Solutions from Solids
Combine a little solid and a little water and the solution is clear! An experimental lesson has individuals make calculations to create a sample solution of a given volume and molarity. They then create the solutions using a virtual lab...
Math-U-See
Algebra 1 Readiness Test
Your learners will appreciate this assessment of basic skill calculations that are prerequisite to Algebra1. Adding, subtracting, multiplying, and dividing procedures are addressed in conjunction with whole numbers, decimals, fractions,...
Teachers Pay Teachers
Multiple Intelligence Survey for Kids
Scholars rate 24 statements 0-5 then calculate their responses to discover their preferred intelligence and which intelligences require more practice.
WindWise Education
When is a Wind Farm a Good Investment?
When will a wind farm pay for itself? Individuals calculate the anticipated annual revenue for two proposed wind farms. By comparing the number of years it takes to pay back the initial investment, they determine which site makes the...
CK-12 Foundation
Counting Events: Flipping Unfair Coins
Who said life was fair? An interactive uses an area diagram to represent the probabilities of flipping unfair coins. Pupils use the diagram to calculate the probabilities of outcomes of flipping the two coins. The scholars must decide...
CK-12 Foundation
Volume by Cross Section: Volume of the Cone
Discover another way to find the volume of a cone. Pupils explore how the area of a cross section changes as it moves through a cone. The interactive uses that knowledge to develop the integral to use to find the volume of the cone....
Chemistry Collective
Virtual Lab: Textbook Style Limiting Reagents Problems
Time to test the limits! Young scientists make limiting reagent calculations and test their math using a virtual lab simulation. Using their knowledge of ionic compounds, they determine the limiting reagents and the excess compounds.
EngageNY
Modeling Relationships with a Line
What linear equation will fit this data, and how close is it? Through discussion and partner work, young mathematicians learn the procedure to determine a regression line in order to make predictions from the data.
EngageNY
The Graph of a Linear Equation—Horizontal and Vertical Lines
Graph linear equations in standard form with one coefficient equal to zero. The lesson plan reviews graphing lines in standard form and moves to having y-coefficient zero. Pupils determine the orientation of the line and, through a...
Other popular searches
- Graphing Calculator Skills
- Calculator Skills Memory
- Calculator Skills Ti84
- Calculator Skills Code Words


