Curated OER
Valentine Heart Candy
Each student gets a box of candy Valentine hearts. The students open the box and count how many of each colored heart they have in their box. The students use this information to make a bar graph and answer follow-up questions.
Curated OER
Sorting and Analyzing
Students explore sorting and graphing. In this math lesson, students create and analyze a class bar graph about their birthday months. They then estimate and sort candies to make and analyze their own bar graph.
Curated OER
Circle Up Your M&Ms
Fifth graders estimate how many M&Ms are in a pre-counted bag. They determine how many colored M&Ms are in a bag, then decide which of the two, bar graph or circle graph (in this case, circle graph) would be best to show te results.
Curated OER
Probability Using M&M's
Students estimate and then count the number of each color of M&M's in their bag. In this mathematics lesson, students find the experimental probability of selecting each color from the bag. Students create pictographs and bar graphs...
Curated OER
Easter Candy Count
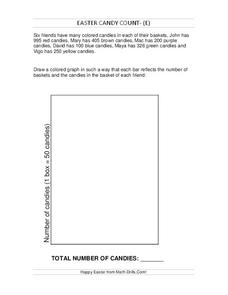
In this bar graph worksheet, students fill in the bar graph based on the information about Easter candy that each child got. Students complete 6 spaces in the bar graph and find the total number of candies.
Curated OER
Easter Candy Count
In this bar graph worksheet, learners fill in the bar graph with the information of Easter candy that each child has and find the total. Students fill in 6 bars in the bar graph.
Curated OER
Easter Candy Count
In this bar graph activity, students complete a bar graph based on the information of Easter candy they are given for each color. Students complete 6 spaces in the bar graph and find the total.
Curated OER
Easter Candy Count
In this bar graph activity, students complete a bar graph based on the information of Easter candy they are given for each color. Students complete 6 spaces in the bar graph and find the total.
Curated OER
Easter Candy Count
In this bar graph worksheet, students complete a bar graph based on the information of Easter candy they are given for each color. Students complete 6 spaces in the bar graph and find the total.
Curated OER
The Candy Color Caper
Students explore the concept of probability. They calculate the probability of an event happening and graph their results. Students determine the probability of winning a sweepstakes. They construct a bar graph to represent all the...
Curated OER
Graphing Our Favorite Candy Bars
Young scholars use ClarisWorks to graph class' favorite candy bars on a bar graph.
Curated OER
Mean, Median, Mode, etc.
Explore the concept of mean, median, and mode with pupils. They estimate the length of a string or the number of M&M's in a jar. Then find the mean, median, and mode of the class' estimates.
Curated OER
Build a Skittles Graph
Students construct a bar graph with a given set of data. They calculate the ratio and percent of the data. Students discuss alternate ways of graphing the data as well as multiple strategies to approach the task.
Curated OER
Charts and Graphs
Fifth graders interpret data into graphs and percentages. In this organizing data instructional activity, 5th graders discuss bar, circle and line graphs. Students complete bar graph and apply probability using the results.
Curated OER
Which Graph is best?
Students use commercial software to organize and visually display data to draw conclusions; students use graphing software to create several types of graphs illustrating the number of each color of M&M's in one bag.
Curated OER
Dynamite Data
Second graders rotate through a variety of stations designed to offer practice in manipulating data. They sort, tally and count items and then create bar graphs, tables, and pie graphs to record their findings.
Curated OER
Heart to Heart
Students predict the outcome of a question and conduct a survey and record their findings on a bar graph.
Curated OER
SkittleGraphs
Second graders discover how to make a bar graph. Each student receives a bag of Skittles candy. They make a bar graph which documents the colors found in the bag. At the end of the lesson plan, the Skittles are eaten. Fun!
Curated OER
5 Sense Bear
Students become familiar with their five senses through the creation of a sense bear. In this five senses lesson, students create a bear and add cinnamon and a candy cane to the bear. Students use their five senses with this bear...
Curated OER
Candy Bar Survey
Second graders investigate the skill of graphing data by using candy bars to create context for the lesson. They use technology for graphing and organizing information like a spreadsheet. The lesson includes a resource link to aid in the...
Curated OER
Raising the Bar While Hogging the Ham (Radio That Is)
Learners create a bar graph that communicates an amount without the need to know the exact data, determine what scale to use to best represent the data and use their bar graph to persuade others.
Curated OER
Graphing
Young scholars investigate graphing. In this bar graph lesson, students view an informational website about graphing, then construct a class birthday bar graph outside with sidewalk chalk. Young scholars choose a survey topic, then...
Curated OER
Skittle Math
In this skittle math worksheet, students sort skittles by color and create a bar graph for each color of skittle. Students also answer comparison, ratio, and relationship questions about the skittles.
Curated OER
Graphing Valentine Candies
Fifth graders organize and display information in bar graph form using appropriate labels. Each student receives a box of Valentine heart candies, a worksheet of the tally chart and a worksheet of the bar graph.


