Curated OER
A Bar of Many Colors
Second graders use colored candies to collect data, construct double bar graphs, and find averages.
Curated OER
Math, Sweet Math Activity Sheet
In this candy graphing worksheet, 1st graders will place candy on their paper to create a bar graph. They will answer several questions based on their data. A teacher checklist is provided.
Curated OER
Junk Food Math
Students use Skittles candies as they explore estimation and percentages. In this math lesson plan, students sort, count, and chart Skittles candies to learn about estimation and study percentages.
Curated OER
Math: How Many Red M&Ms?
Sixth graders calculate the mean, median, and mode of candy M&Ms and find the percentage of each color. Once they complete the assignment, they compare their results with those of the candy company's percentages. As an extension,...
Curated OER
Build A Skittles Graph
Students explore graphing. In this graphing lesson, students sort Skittles candies and use the color groups to create a bar graph. Rubrics and extension activities are provided.
Curated OER
Sorting and Analyzing
Students explore sorting and graphing. In this math lesson, students create and analyze a class bar graph about their birthday months. They then estimate and sort candies to make and analyze their own bar graph.
Curated OER
Graphing It Out
Students create bar graphs. In this graphing lesson, students explore the concepts of net pay, gross pay, income and expenses. They create a bar graph to designate financial outlay during a specified period.
Curated OER
Probability Using M&M's
Students estimate and then count the number of each color of M&M's in their bag. In this mathematics lesson, students find the experimental probability of selecting each color from the bag. Students create pictographs and bar graphs...
Curated OER
Sorting Sweethearts
In this holiday worksheet, students estimate how many heart candies are in a cup. Then, students sort their hearts and add up how many are in each color and how many there are total. Students also create a bar graph that displays how...
Curated OER
What Would You Spend Your Money On?: Graph
In this bar graph worksheet, students will ask their classmates which object they would spend their money on: a toy, candy or a book. Then students will record the responses to complete the graph.
Curated OER
Hershey Chocolate Fractions
In order for students to acquire knowledge about math concepts, and in particular fractions, they need concrete ways to practice an abstract concept.¿¿¿ Using Hershey bars builds on prior knowledge as most students have probably...
Curated OER
Half - A Fractions Lesson
First graders explore the fraction half. In this fractions lesson, 1st graders watch a video that show the half fraction. They divide a Kit Kat bar in half and do a fraction activity sheet.
Curated OER
Raising the Bar While Hogging the Ham (Radio That Is)
Learners create a bar graph that communicates an amount without the need to know the exact data, determine what scale to use to best represent the data and use their bar graph to persuade others.
Curated OER
Mean, Median, Mode, etc.
Explore the concept of mean, median, and mode with pupils. They estimate the length of a string or the number of M&M's in a jar. Then find the mean, median, and mode of the class' estimates.
Curated OER
Making Sense of the Answer- Solving Word Problems
In this math problem solving worksheet, students read each word problem, underline the code words, and write the operation that should be used to solve each problem. They explain their reasoning for choosing the particular operation.
Curated OER
Fractions
Students determine that a fraction is a part of a whole or part of a group. They write and read fractions and solve various fraction problems. They create their own fraction problem using colored candies for their classmate to solve.
Curated OER
Sweet Data
Students input data about the colors of their serving of M&M candies onto a spreadsheet. They create charts and graphs based on this information.
Curated OER
Hersey'n On Fraction
Learners use a Hersey bar to help them practice with fractions. The teacher gives a fraction and they are to create it with the chocolate bars.
Curated OER
Comparing Candy Bars
Eighth graders identify that a ratio is a comparison of two numbers and that a proportion is an equation that equates two ratios. They identify the extremes and means of proportions, as well as the product of the extremes equals the...
Curated OER
Charts and Graphs
Fifth graders interpret data into graphs and percentages. In this organizing data instructional activity, 5th graders discuss bar, circle and line graphs. Students complete bar graph and apply probability using the results.
Curated OER
Models for Dividing Fractions
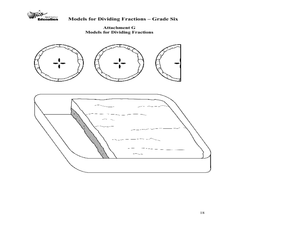
Sixth graders represent division of fractions using manipulatives, such as freezer pops, candy bars, and models such as drawings squares. They develop an algorithm from these examples and solve problems using fractions.
Curated OER
Teaching Fractions-Thirds
If you have The Hershey Chocolate Candy Bar book, reading it makes an alluring anticipatory activity for a lesson on fractions. Learners use paper cutouts to consider the concept of thirds. The lesson concludes with a Bingo-style...
Ohio Department of Education
Models for Dividing Fractions - Grade Six
Fifth and sixth graders use food and candy to help them represent division of fractions and develop algorithms to solve fraction problems. They discuss dividing whole numbers by fractions. Pupils use sticks and chocolate bars to study...


