Yummy Math
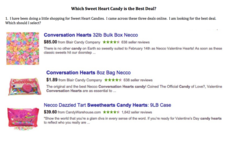
Which Sweet Heart Candy Is the Best Deal?
Get the most Valentine's candy for your money with a fun math activity! After examining three deals for buying candy hearts in bulk, young mathematicians decide which deal is the best and use bar graphs to demonstrate their claim. They...
Curated OER
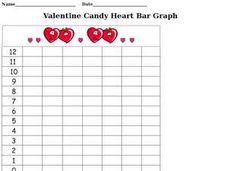
Valentine Candy Heart Bar Graph
For this Valentine candy heart bar graph worksheet, students complete a bar graph illustrating how many different colored candy hearts they received for Valentine's Day.
Curated OER
Valentine Candy Count
Here is an imaginative take on a classic lesson! Young scholars discover what color Valentine Candy is found more often than any other in a standard bag of Valentine Conversation Hearts. They observe, predict, sort, and classify the data...
Curated OER
Grab the Candy Hearts
For this candy activity, learners play the game Grab the Candy for Valentine's Day where they roll dice to find ordered pairs on a graph and place the candy inside that square. Students play until all candy is gone and use the scoring...
Curated OER
Conversation Hearts Graph: Valentine's Day
In this graphing conversation hearts worksheet, students sort and count the colors of candy hearts, and determine which color had the most and least numbers. Students answer eight questions.
Curated OER
Valentine Heart Candy
Each student gets a box of candy Valentine hearts. The students open the box and count how many of each colored heart they have in their box. The students use this information to make a bar graph and answer follow-up questions.
Curated OER
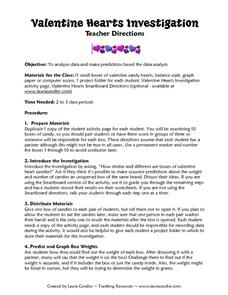
Valentine Hearts Investigation
Students practice analyzing data and making predictions. In this 2nd - 3rd grade lesson plan, students investigate and compare data gathered using boxes of valentine candy hearts. Students examine the different boxes of candy provided,...
Curated OER
Valentine's Day Math
First graders sort their candy hearts into piles according to color and record a tally mark under the color for each candy heart that they have on the worksheet. They then record the total amount of tally marks for each color of candy...
Curated OER
Graphing Conversation Hearts
Students collect data and create a graph. In this mathematics lesson, students separate paper hearts by color and create a graph showing the number of hearts of each color present. Students receive a handful of candy hearts that they use...
Curated OER
Heart to Heart
Students predict the outcome of a question and conduct a survey and record their findings on a bar graph.
Curated OER
Graphing Valentine Candies
Fifth graders organize and display information in bar graph form using appropriate labels. Each student receives a box of Valentine heart candies, a worksheet of the tally chart and a worksheet of the bar graph.
Curated OER
Valentine Candy Count
Students investigate what color Valentine Candy is found more often than any other in a standard bag of "Valentine Conversation Hearts." They sort, classify and graph their findings.
Curated OER
Valentine Candy Count
Students analyze a bag of Valentine candy to create a graph. In this graphing lesson, students make predictions, sort by color, record data and make a graph. Students discuss results and make generalizations. Students generate their own...
Curated OER
Valentine's Day Math
First graders explore sorting and classifying. In this math lesson, 1st graders sort conversation hearts based on color. Students graph their results and enjoy the candy!
Curated OER
Valentine Hearts
Students sort candy Valentine hearts into groups and create individual graphs.
Curated OER
Put Your Heart Into It
First graders sort Valentine candies according to kind. Data is inserted into a spreadsheet and displayed in various graphic formats.
Curated OER
Sorting Sweethearts
In this holiday worksheet, students estimate how many heart candies are in a cup. Then, students sort their hearts and add up how many are in each color and how many there are total. Students also create a bar graph that displays how...
Curated OER
Classification Introduction
Students simulate classifying rocks using different colored skittles. In this earth science activity, students create a Venn diagram according to their compiled information. They share this diagram in the class.


