Curated OER
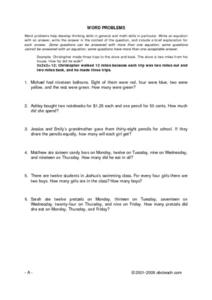
Problem Solving Page 1
For this math worksheet students read 7 word problems. Students are to solve each word problem and label the answers. Students are also asked to illustrate each problem.
Curated OER
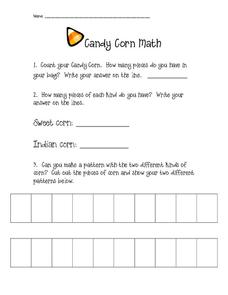
Candy Corn Math
In this autumn themed math learning exercise, students complete counting, classifying, and sequencing activities with candy corn. They receive bags of candy corn and sort the pieces. They cut out small pictures of the candy to glue onto...
Curated OER
M & M's Candy Color Chart
For this graphing worksheet, students open a package of M & M candies and use this prepared graph to record how many of each color are present.
Curated OER
Counting Christmas Candy Canes
In this counting Christmas candy canes worksheet, students count the candy canes, then circle or color the numeral (from a series of three) that tells how many.
Curated OER
Math: How Many Red M&Ms?
Sixth graders calculate the mean, median, and mode of candy M&Ms and find the percentage of each color. Once they complete the assignment, they compare their results with those of the candy company's percentages. As an extension,...
Curated OER
Trading Candy
In this math worksheet, learners count out pieces of candy to find the answer of a subtraction problem. There is 1 question on this worksheet, with no answer key.
Curated OER
Candy is Dandy
Students view the benefits of using graphs to communicate information, answer questions and solve problems. They investigate color distribution in bags of M & M's. Working with actual bags of candy, they will sort and classify contents.
Curated OER
Fall Treasures: Counting Candy Corn
For this early childhood fall activity emergent reader booklet worksheet, students cut out the 6 pages and construct a candy corn counting booklet that may be read again and again.
Curated OER
Math by M&M's
First graders review math skills with M&M's. In this math lesson, 1st graders practice addition and subtraction skills with M&M candies.
Curated OER
Mr. Funny Bones Math
In this Mr. Funny Bones math worksheet, learners count the total number of candy bones, sort them into five categories, and graph the number of each kind. Students graph five groups of bones.
Curated OER
Sorting Sweethearts
In this holiday worksheet, students estimate how many heart candies are in a cup. Then, students sort their hearts and add up how many are in each color and how many there are total. Students also create a bar graph that displays how...
Local School Directory
Fractions - Word Problems
This resource revolves around an assignment of 10 real-life applications using the addition and subtraction of fractions. Topics include compact discs, candy, cake, cookies, collecting money, and more! A detailed explanation of the...
Curated OER
What's in a Graph?
How many yellow Skittles® come in a fun-size package? Use candy color data to construct a bar graph and a pie chart. Pupils analyze bar graphs of real-life data on the Texas and Massachusetts populations. As an assessment at the end of...
Stats Monkey
Everything I Ever Needed to Learn about AP Statistics I Learned from a Bag of M and M's®
Candy is always a good motivator! Use this collection of M&M's® experiments to introduce statistics topics, including mean, standard deviation, nonlinear transformation, and many more. The use of a hands-on model with these AP...
Firelands Local Schools
Exponential Growth and Decay
How can you safely model exponential growth and decay? A hands-on activity uses candies to model not only exponential decay, but also exponential growth. Exponential equations are fitted by hand and by use of a calculator to the data...
Statistics Education Web
Population Parameter with M-and-M's
Manufacturers' claims may or may not be accurate, so proceed with caution. Here pupils use statistics to investigate the M&M's company's claim about the percentage of each color of candy in their packaging. Through the activity,...
Howard County Schools
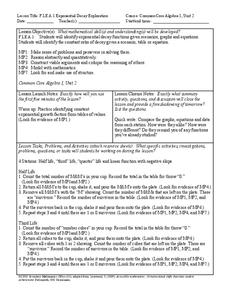
Exponential Decay Exploration
How can you model exponential decay? Explore different situations involving exponential decay functions and decreasing linear functions by performing activities with MandM candy, popcorn kernels, and number cubes.
PHET
Unit Rates
Sometimes you just want to know the cost of one apple. A fun interactive lets learners explore the unit costs of fruits, vegetables, and candy. It shows how ratios to express ratios symbolically and on a double number line.
Pace University
Grades 7-8 Mean, Median, and Mode
Take a central look at data. The differentiated lesson plan provides activities for pupils to calculate central tendencies. Scholars begin choosing three central tendency activities from a Tic-Tac-Toe board. Learners then choose from...
Virginia Department of Education
Translate and Evaluate
Hopefully nothing gets lost in translation. Pupils translate between verbal phrases and algebraic expressions. They then use candy to determine what values to substitute into the expressions.
Curated OER
The Easter Basket
In this math review worksheet, learners complete addition, multiplication, division, and subtraction problems where each answer equals a certain amount of candies. Students solve 10 problems and answer 4 questions.
Curated OER
Graphing With Candy
Students gather information and interpret the results using a tally chart, a table, and a bar graph.
Curated OER
Gummy Bear Math
First graders predict, collect data, and create a graph based on gummy bear colors they are given. In this graphing lesson plan, 1st graders first predict how many colors of gummy bears there are. They then count the colors, graph them,...
Raytheon
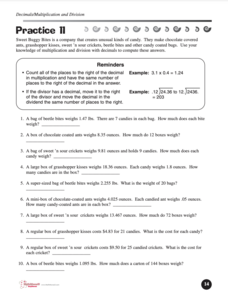
Decimals: Multiplication and Division
Use this fine packet of decimal worksheets to help your charges study directions and work through examples for how to solve multiplication and division problems using decimals. They complete a total of 91 problems showing all if their work.
Other popular searches
- Twizzlers Candy Math
- Halloween Candy Math Lessons
- Candy Math Skittles
- Twirlers Candy Math
- Candy Math Mean
- Halloween Candy Math
- Candy Math Activities
- Candy Math Patterns
- Candy Math Addition
- Candy Math and Patterning
- Valentine Candy Heart Math
- Candy Math California


