Curated OER
Reading Points on a Graph
For this reading points on a graph worksheet, students read and identify points on a coordinate plane. They place their answers in the form of an ordered pair. Students identify 20 points. They may enter their answers on the webpage...
Curated OER
Graphing Linear Equations
Ninth graders review the information that they have already learned
with regard to linear equations and graphical representations. They then assist in combining equations with a graphical element and complete various graphs with this...
Raytheon
Equations and Graphing Review
In this equations and graphing review instructional activity, learners write, graph and solve equations for 62 problems, including a mid-unit review, with answers included.
Blogger
Standard Form of a Linear Equation
Organize your learners with this well-laid-out note-taking printable. Note blanks are organized to allow for two strategies of graphing an equation given in standard form.
Mathematics Assessment Project
Classifying Equations of Parallel and Perpendicular Lines
Parallel parking might be difficult, but finding parallel lines is fairly simple. In this instructional activity, learners first complete an assessment task involving parallel and perpendicular lines in the coordinate plane. Individuals...
West Contra Costa Unified School District
Solving Systems of Inequalities
Don't throw away those transparency sheets just yet! Young scholars first review inequalities on a number line, then learn about graphing inequalities in the coordinate plane. Finally, they use overhead transparencies to create systems...
University of Colorado
Solving a Mixed Up Problem
Begin the process of adding and subtracting spectra. Having a basic understanding of occultation events, pupils begin the pursuit to determine what a found atmosphere might contain. Learners work with two graphs and calculate what the...
Curated OER
Barbie Bungee
Middle and high schoolers collect and analyze their data. In this statistics lesson, pupils analyze graphs for linear regression as they discuss the relationship of the function to the number of rubber bands and the distance of the...
Curated OER
Graph Functions with Integers
Fifth graders can do a quick review of graphing functions using integers with this worksheet. The worksheet has questions which require students to identify the pertinent information in a word problem, and create a graph to represent the...
Curated OER
Three Sets of Mental Math Problems covering Coordinates and Integer Values
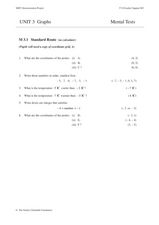
In this mental math worksheet, students solve sixteen problems given in three sets. The problems are to be done without a calculator and they cover coordinates and integer values. The solutions are provided.
Curated OER
Exploring Area/Perimeter Through Coordinate Geometry
Students explore area and perimeter through coordinate geometry using student literature, hands-on manipulatives, and the Internet.
Curated OER
Graphing Inequalities in Two Variables
In this graphing inequalities instructional activity, 9th graders solve and graph 6 different problems that include two variables. First, they define the given vocabulary terms found at the top of the sheet. Then, students graph each...
Curated OER
Generating Points and Graphing
Students create a table of values to help them plot. For this algebra lesson, students plot their points on a coordinate plane creating a graph. They observe and analyze linear functions.
Curated OER
Coordinates
In this coordinates worksheet, 6th graders provide the coordinates for the points on the graphs. Students complete 4 problems total on this worksheet.
Curated OER
Parabolas
In this parabolas worksheet, 11th graders solve and complete 12 different problems. First, they use the graph to write the equation of each parabola. Then, students name the vertex for each and write their responses on the line provided.
Curated OER
Math Mediator Lesson 10: Slope
Students explore the concept of slope. In this Algebra I lesson, students investigate the definition of slope as rise over run or change in y compared to change in x. The lesson includes a real-world problem in which the height of high...
Curated OER
What's Your Shoe Size? Linear Regression with MS Excel
Learners collect and analyze data. In this statistics lesson, pupils create a liner model of their data and analyze it using central tendencies. They find the linear regression using a spreadsheet.
Curated OER
Four Quadrant Grid
Use this math worksheet to have your charges engage in positive and negative numbers for math coordinate graphing purposes. There are no questions on the page which is labeled for grade 5.
Curated OER
Exponential Functions
In this algebra activity, learners compute 4 functions for a given value. They graph 4 functions, and write equations for two graphs. Each function has an exponent as the variable.
Curated OER
Systems of Equations in Two Variables
In this algebra worksheet, students work with pairs of linear equations. Three problems ask students to determine if the given ordered pair is a solution of the system of equations. Students graph two systems to determine the solution.
Curated OER
Slope Intercept Form
In this slope intercept form worksheet, students solve and graph 6 different problems that include identifying the slope and intercepts in each graph. First, they determine the line that has a given x-and y-intercept. Then, students find...
Curated OER
Graphing Linear Equations Using Data Tables
Pupils review the Cartesian plane and the process of plotting points. In groups, students create tables, identify the slope and y-intercept, and graph the equation. Afterward, pupils perform the same process, only, individually. As a...
Curated OER
Graphing Ordered Pairs
In this graphing ordered pairs worksheet, 9th graders graph five different sets of numbers on five different graphs. They identify that each of the x-coordinates tells the distance right (positive) or left (negative) and that each...
Curated OER
Coordinates on a Plane
In this coordinates on a plane worksheet, 9th graders solve and complete 9 different types of problems. First, they graph the given coordinates and respond to a number of questions. Then, students find the midpoint and the length of the...


