Curated OER
Graphing Eight Quadratic Inequalities
In this graphing quadratic inequalities worksheet, learners graph eight quadratic inequalities. Cartesian coordinate systems and solutions are provided.
Curated OER
Reading Graphs
For this reading graphs practice worksheet, students examine a graph and respond to 5 questions that require them to record the coordinates of 5 shapes on the gridded graph.
Curated OER
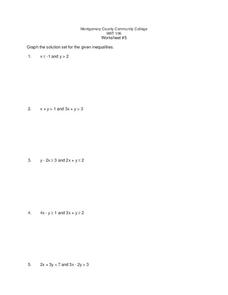
Graphing Linear Inequalities
In this graphing linear inequalities worksheet, 9th graders solve 5 different pairs of problems. For each pair of equations, they graph the solution set for each the given inequalities. Then, they determine if any or all of the solution...
Curated OER
Graphing Systems of Inequalities
In this systems of inequalities worksheet, 11th graders solve and complete 8 different problems that include graphing. First, they graph each system of inequalities to determine the overlapping portion in each. Then, students draw a line...
Curated OER
Making an Alien Mask Using Coordinate Pairs
In this math worksheet, students create an alien mask and practice graphing coordinate pairs. Students follow the directions to plot coordinates on an x and y axis. When they are finished students will see an alien face which can be made...
Curated OER
Independent Practice 2: Graphing Lines by Graphing Two Points
In this graphing lines worksheet, learners solve linear equations and then graph the points on the line. This one-page worksheet contains six problems with a coordinate plane provided for each one.
Curated OER
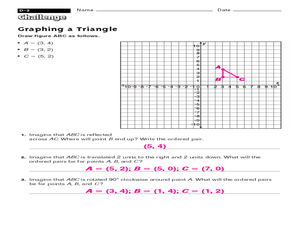
Graphing a Triangle
In this geometry skills worksheet, students graph a triangle using the provided information and then respond to 3 short answer questions regarding it.
Curated OER
TAKS 5th Grade Daily Upkeep 10
For this mathematics worksheet, students practice finding the coordinates found in the Cartesian graphing style for the three problems.
Curated OER
Coordinates
In this geometry worksheet, 10th graders are given points on a coordinate plane, and they must figure out what the x and y values are. There are 6 graphing question.
Curated OER
Reflections in the Plane
Have your class explore the concept of reflections as they use Cabri Jr. to construct a triangle and reflect it over a line. Learners reflect shapes across the coordinate plane and across the lines y = x and y = -x.
Curated OER
Year 5 - Term 2
This incredibly thorough and challenging presentation should engage all of your young math whizzes. Each of the 94 slides has tips, problems, puzzles, and brain teasers that will test the math abilities of even your top learners. An...
Curated OER
It's a Drag!
Students create number lines using decimals and whole numbers. In this algebra lesson, students graph and solve linear equations. They plot ordered pairs on a coordinate plane correctly.
Curated OER
Determine the Coordinate of Transformations
Young scholars investigate transformation on a coordinate plane. In this geometry lesson, students identify pairs of coordinates and their location on the grid. They perform rotation and reflection of each polygon.
Curated OER
Plotting Grids Using Battleship
Learners coordinate grid points on X and Y axises to plot a physical location. The game of "Battleship is used to present first hand knowledge of this skill.
Curated OER
Graphing Inequalities
Students graph linear equations and then find the person in class whose linear equation graph is perpendicular to theirs. In this graphing inequalities lesson plan, students graph their perpendicular slopes and then once their find their...
Curated OER
Games, Grids, and Graphs
In this math worksheet, learners look for the relationships between ordered pairs. They find the missing values and plot them on the x and y axis.
Curated OER
Tables and Linear Graphs
In this tables and linear graphs worksheet, students examine linear functions. They solve equations and graph them on a coordinate plane. This four-page worksheet contains 8 multi-step problems. Answers are provided on the last page.
Curated OER
Matrix Madness!!
Perform operations to add, subtract, multiply and divide matrices. Then solve problems with vectors using matrices. A three day activity: Matrix Madness, Mystical Matrices, and Decode the Encode. The last activity has prizes that the...
EngageNY
Constant Rate
Two-variable equations can express a constant rate situation. The lesson presents several constant rate problems. Pupils use the stated constant rate to create a linear equation, find values in a table, and graph the points. The resource...
Shodor Education Foundation
Conic Flyer
Graphing conics made easy. Individuals use an interactive to graph conic sections. The app can handle circles, vertical and horizontal parabolas, ellipses, and vertical and horizontal hyperbolas.
Shodor Education Foundation
Multi-Function Data Flyer
Explore different types of functions using an interactive lesson. Learners enter functions and view the accompanying graphs. They can choose to show key features or adjust the scale of the graph.
Curated OER
Line of Best Fit
In this line of best fit worksheet, students solve and complete 8 different problems that include plotting and creating their own lines of best fit on a graph. First, they study the samples at the top and plot the ordered pairs given on...
Shodor Education Foundation
Linear Inequalities
An interactive lesson helps individuals learn to graph inequalities in two variables. Scholars can adjust the interactive to present the inequalities in standard or slope-intercept form.
Shodor Education Foundation
Scatter Plot
What is the relationship between two variables? Groups work together to gather data on arm spans and height. Using the interactive, learners plot the bivariate data, labeling the axes and the graph. The resource allows scholars to create...


