Curated OER
Data Collection and Presentation
Middle and high schoolers collect and analyze data from four different activities. The activities include information about classmates, tallying colors of cars in a parking lot, stem and leaf plots, and making a histogram from winning...
Shodor Education Foundation
InteGreat
Hands-on investigation of Riemann sums becomes possible without intensive arithmetic gymnastics with this interactive lesson plan. Learners manipulate online graphing tools to develop and test theories about right, left, and midpoint...
Natinal Math + Science Initative
Slope Investigation
Context is the key to understanding slope. A real-world application of slope uses a weight loss scenario with a constant rate of change to introduce the concept of slope of a line, before it makes a connection to the ordered pairs and...
EngageNY
End-of-Module Assessment Task - Algebra 2 (Module 1)
A series of assessment tasks require learners to process information and communicate solutions. Topics include graphing parabolas, solving linear-quadratic systems, factoring polynomials, and solving polynomial equations.
Curated OER
LAND USE ISSUES
Learners relate math with real life situations. They identify and plot points on a grid map. They identify and locate the Drop Box Sites.
Curated OER
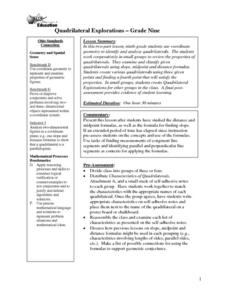
Quadrilateral Explorations
Ninth graders identify quadrilaterals and label the vertices of quadrilaterals. they justify their identification of the quadrilaterals. Students work in groups to identify and create quadrilaterals
Curated OER
Gummy Bear Picture Graph
First graders investigate picture graphs. In this graphing instructional activity, 1st graders create a picture graph with the x-axis being number and the y-axis being color. Students sort their gummy bears by color and use pictures of...
Curated OER
Using Tables
In this using tables learning exercise, 9th graders solve and complete 10 various types of problems that include using tables to determine information. First, they write an equation to determine the total amount. Then, students define...
Curated OER
Exponential Functions
In this exponential functions activity, 9th graders solve and complete 23 various types of problems. First, they simplify each expression. Then, students evaluate the function at different values of x and plot the ordered pairs. in...
Curated OER
Finding Domain and Range
In this domain and range worksheet, students observe a graph and identify the domain and range of given functions. Afterwards, they solve functions to identify the range. Fifteen problems are provided on this one-page worksheet.
Curated OER
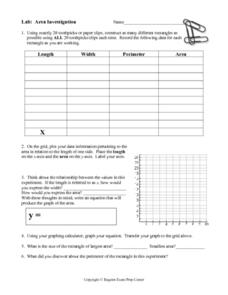
Area Investigation
In this area investigation learning exercise, 8th graders solve and complete 6 different problems that include complete a chart with given data and a graph. First, they construct as many different rectangles as possible using toothpicks....
Curated OER
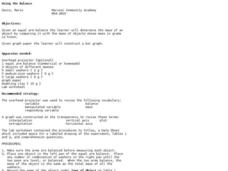
Using the Balance
Students determine the mass of various objects. In this integrated math and science lesson, students use an arm balance to compare a known object to a combination of washers with a fixed weight. Students record data, construct a bar...
Curated OER
Magnetic Storms
In this magnetic storms learning exercise, students use a graph of data collected over time showing the magnitude of a magnetic storm. Students use the data to solve 6 problems about the graph and they determine the strength of the storm...
Curated OER
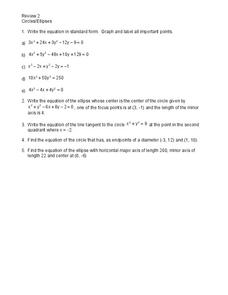
Circles and Ellipses
In this circles and ellipses worksheet, students solve and complete 5 different types of problems. First, they write each equation in standard form. Then, students graph and label Write the equation of the ellipse whose center is the...
Math Worksheets 4 Kids
Point of Intersection Worksheet 2
Math wizards rewrite pairs of linear equations in the y-intercept form and graph them on a coordinate plane. They identify where the lines cross, i.e. the point of intersection. There are four questions with coordinate planes for drawing...
Illustrative Mathematics
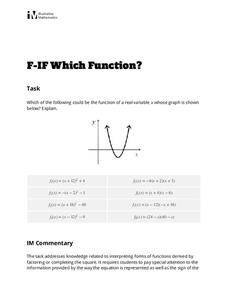
Which Function?
Learners are given a graph of a parabola on a coordinate system, but intercepts and vertex are not labeled. The task is to analyze eight given quadratic functions and determine which ones might possibly be represented by the graph. The...
Curated OER
Linear Piecewise Functions
Students explore the concept of piecewise functions. In this piecewise functions instructional activity, students graph piecewise functions by hand and find the domain and range. Students make tables of values given a piecewise function....
Curated OER
Lines, Lines, Everywhere
Students explore linear equation suing real life scenarios. In this algebra lesson, students find the slope and intercept of a line. They create table of values to plot their graph and draw conclusions.
Virginia Department of Education
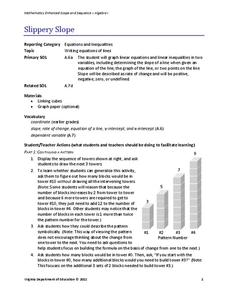
Slippery Slope
Explore slope using geometric patterns. Young mathematicians investigate towers built from cubes to develop a linear pattern. They move the data to a coordinate plane to connect the pattern to slopes.
Curated OER
Functions
In this algebra worksheet, learners look at 4 sets of relations and determine if they are functions. Students are provided with the graphs of three functions and determine the function value. Two relations are graphed on the coordinate...
Curated OER
Who Shares My Function?
Students differentiate between linear and quadratic functions. In this algebra lesson plan, students write equations of graphs and graph a function from an equation. They also move the graph around on the coordinate plane.
Radford University
“FUN-ctions” Find the Equation of a Scream
Take a function along for a ride. Given the graph of a roller coaster track, pupils determine key features of the graph such as the maximum, minimum, intervals of increase and decrease, and roots. They figure out the equation of the...
Curated OER
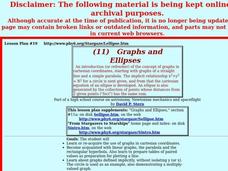
Graphs and Ellipses
Students explore linear graphs, the parabola and the rectangular hyperbola.
Curated OER
Points in the Complex Plane -- Lab
Students review the lecture portion of this lesson. Individually, they graph various points on a complex plane and identify conjugates based on their location on the graphs. They complete a worksheet and review their answers to end the...


