Curated OER
Sign of the Derivative
Learn how to investigate the change in a graph by dragging the cursor to observe the change in the function. They use the TI calculator to graph their parabola.
Curated OER
How Many Solutions to the System?
Solve systems of equation using graphing! In this algebra activity, high schoolers use the TI to graph two lines and identify the number of solutions. They perform interactive graphing on the navigator.
Curated OER
Osprey Journey
Students investigate the migration route of one bird, Osprey B4, using information gathered from satellites to track birds over a two-year period. They coimpare their graphs with maps of B4's migrations that have been plotted by...
Curated OER
Woody Sine
Students explore the concept of sine. In this sine instructional activity, students create a sine graph from tooth picks. Students create a unit circle with tooth pick length radius. Students then take the tooth picks from the unit...
Curated OER
Cookie Mapping
Students study the components of a bedrock geology map through a hands-on activity involving a cookie and graph paper.
Curated OER
Solving Inequalities
For this inequalities worksheet, students solve and graph inequalities. They shade the answer region. Explanations and examples are provided at the beginning of the document. Answers are at the end of the worksheet. This four-page...
Curated OER
Cook Me Up Some Equations
Students study a variety of math concepts in the context of cooking up a meal. For this math lesson, students calculate surface area and volume. They draw and interpret different types of graphs.
Curated OER
Introduction To Data Analysis
Seventh graders investigate the concept of looking at the data put in a variety of ways that could include graphs or data sets. They analyze data critically in order to formulate some sound conclusions based on real data. Students graph...
Curated OER
Measurement and the Illampi Mound Colony
Students comprehend the basic units of measurement, scale, plotting, and basic grids. Students practice their estimation
and measuring skills and will demonstrate their ability to work well in groups.
Curated OER
Solve a System of Inequalities
In this system of linear inequalities worksheet, students solve 5 problems with the graphing method and are given 2 examples with multiple steps to follow.
Curated OER
Maximum and Minimum Problems
In this maximum and minimum problems worksheet, students solve and complete 9 various types of problems. First, they find two numbers with a given sum. Then, students find the maximum and minimum value of each equation. They also find...
Curated OER
Ordered pairs and total number of items
In this ordered pairs and total number of items worksheet, students answer multiple choice questions about ordered pairs and number totals. Students complete 10 multiple choice questions.
Curated OER
R & R - Incorporating Literature While Teaching Math - Ordered Pairs - "The Polar Express"
Third graders create pictures using ordered pairs after listening to a piece of literature. In this ordered pairs and literature instructional activity, student listen to and discuss The Polar Express by Chris Van Allsburg. They...
Curated OER
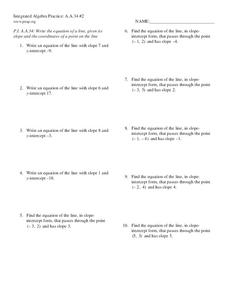
Linear Equations
In this Algebra I/Algebra II worksheet, students determine the equation of a line from the graph. The one page worksheet contains ten problems. Answers are not provided.
Mathematics Vision Project
Module 6: Congruence, Construction, and Proof
Trace the links between a variety of math concepts in this far-reaching unit. Ideas that seem very different on the outset (like the distance formula and rigid transformations) come together in very natural and logical ways. This...
EngageNY
How Do Dilations Map Segments?
Do you view proofs as an essential geometric skill? The resource builds on an understanding of dilations by proving the Dilation Theorem of Segments. Pupils learn to question and verify rather than make assumptions.
EngageNY
Four Interesting Transformations of Functions (Part 3)
Continue the study of transformations with an examination of horizontal stretches, shrinks, and reflections. Individuals use the same process used in parts one and two of this series to examine horizontal changes. The resource also...
Curated OER
Triangles Inscribed in a Circle
Are you tired of answers without understanding? Learners can give a correct response, but do they really understand the concept? Have young mathematicians think deeper about linear functions, angles, and formulas in algebra....
Curated OER
Tracking the Storm
Students discuss the different types of storms that can hit land. They locate specific coordinates on a plane grid. They discuss lonsgitude and latitude to plot the coordinates of a tropical storm. They practice finding coordinates...
Curated OER
Mathematical Relationships
Learners practice graphing a linear equation and a parabolic equation. They work cooperatively to select numbers, including fractions, which they will put into ordered pairs. Students explain their process to the class, discussing what...
Curated OER
2 x 2
Students work together to grid a 2 x 2 meter unit using the formula for the Pythagorean Theorem. After creating the grid, they identify the location of artifacts and create a map of their location. They develop a graph and table of their...
Curated OER
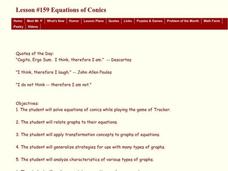
Equations of Conics
Students investigate the graphs of conics. In this Algebra II lesson, students solve equations of conics while playing the game of Tracker. In Tracker the graphs are hidden on a coordinate plane and students use probe shots...
Curated OER
Choosing a Summer Job
What did you do over your summer vacation. Young wage earners must compare summer job options, and determine when each job earn the same amount and what that amount be. This be done by creating, graphing, and solving systems of...
Curated OER
Linear and Nonlinear Functions
Students identify properties of a line. In this algebra lesson, students differentiate between functions and nonfunctions. They use the slope and y intercept to graph their lines.


