Curated OER
Graphing
In this graphing worksheet, 5th graders identify and graph 20 different problems on the 3 different graphs shown on the sheet. First, they use the tally of callers organized by the school to complete the three different types of graphs....
Curated OER
Graphing Game
Students explore the concept of graphing ordered pairs. In this graphing ordered pairs instructional activity, students work in teams to play a version of Connect 4. Students use a Cartesian grid with values -4 to 4 as their Connect 4...
Curated OER
Connecting Algebra and Geometry Through Coordinates
This unit on connecting algebra and geometry covers a number of topics including worksheets on the distance formula, finding the perimeter and area of polynomials, the slope formula, parallel and perpendicular lines, parallelograms,...
Charleston School District
Graphing Functions
How do letters and numbers create a picture? Scholars learn to create input/output tables to graph functions. They graph both linear and nonlinear functions by creating tables and plotting points.
Curated OER
Number Pairs
This engaging coordinate pairs activity will have scholars intrigued; they mark 13 points on a grid and then connect them to create a capital block letter. Which one will it be? The grid has whole numbers 0-10 along both axes, so...
Virginia Department of Education
Graphing Linear Equations
Combine linear equations and a little creativity to produce a work of art. Math scholars create a design as they graph a list of linear equations. Their project results in a stained glass window pattern that they color.
EngageNY
Exploring the Symmetry in Graphs of Quadratic Functions
Math is all about finding solutions and connections you didn't expect! Young mathematicians often first discover nonlinear patterns when graphing quadratic functions. The lesson begins with the vocabulary of a quadratic graph and uses...
EngageNY
The Graph of a Linear Equation in Two Variables Is a Line
Show your class that linear equations produce graphs of lines. The 20th segment in a unit of 33 provides proof that the graph of a two-variable linear equation is a line. Scholars graph linear equations using two points, either from...
EngageNY
Every Line is a Graph of a Linear Equation
Challenge the class to determine the equation of a line. The 21st part in a 33-part series begins with a proof that every line is a graph of a linear equation. Pupils use that information to find the slope-intercept form of the equation...
EngageNY
Graphs of Simple Nonlinear Functions
Time to move on to nonlinear functions. Scholars create input/output tables and use these to graph simple nonlinear functions. They calculate rates of change to distinguish between linear and nonlinear functions.
Curated OER
Geometry: Helix-a-Graph
Students use geometry to create art. In this geometric graphing and patterns instructional activity, students create a helix-a-graph by plotting points on a grid that follow a certain pattern and analyze the drawing they created.
Scholastic
Study Jams! Ordered Pairs
Using an amusing amusement park, Sam describes how it is a coordinate plane and how to graph an ordered pair. Perfect for beginners, the animation moves on to point out a tip using the first quadrant of an empty coordinate plane.
Mt. San Antonio Collage
Quadratic Functions and Their Graphs
Starting with the basics, learners discover the features of a parabola and the ways to accurately graph it. After pupils practice with graphing, the end of the learning exercise focuses on application type problems.
Curated OER
Walking the Plank
This is a cool math activity. Kids collect and interpret data based on a physical act. A board is balanced between a scale and a step, learners record a peer's weight as it decreases while s/he walks further away from the scale. They...
Curated OER
Reading Graphs
Students plot functions on the Cartesian coordinate plane. They explore lines and parabolas. Students analyze graphs and answer questions about the information presented on the graph using an online program.
Curated OER
Graph It!
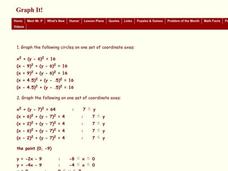
In this graph it worksheet, students graph inequalities on a coordinate plane. This one-page worksheet contains 3 problems.
Curated OER
Plot the x-y Coordinates on the Grids Below
In this coordinate grid graphing worksheet, students plot the given points onto each of 6 coordinate grids. All points are located in quadrant 1. One point is plotted on each grid. Answers are given by clicking the appropriate place on...
Curated OER
Graphing Integers On a Coordinate Plane
Seventh graders explore the concept of graphing integers on a coordinate plane. In this graphing integers on a coordinate plane instructional activity, 7th graders discuss scenarios where coordinate systems are used in real life. ...
Curated OER
Impossible Graphs
Students practice plotting functions on the Cartesian coordinate plane while participating in a discussion about the Possible Or Not worksheet/activity. Students also use the Impossible Graphs worksheet to practice reading a graph,...
Curated OER
Linear Inequalities in One and Two Variables: Rays and Half Planes
Define rays and half planes, including the concepts of boundary lines and prerequisite knowledge of coordinate planes. Given linear inequalities in one and two variables, your class will compare the differences. They will also graph...
Curated OER
Locating IIT Using Ordered Pairs
Students investigate ordered pairs. In this math activity, students plot and locate ordered pairs in a coordinate plane and are exposed to how to read and create a map.
Curated OER
Transforming Triangles
Sixth graders graph translations (slides) and reflections (flips) on a coordinate plane. They visualize and identify geometric shapes after applying transformations on a coordinate plane. Finally, 6th graders write a paragraph telling...
Curated OER
Comparing Costs
Students compare the costs of two cellular phone plans and determine the best rate. They use a table and a graph of points plotted on a Cartesian plane to display their findings. Students write an equation containing variables that could...


