EngageNY
An Appearance of Complex Numbers 2
Help the class visualize operations with complex numbers with a lesson that formally introduces complex numbers and reviews the visualization of complex numbers on the complex plane. The fifth installment of a 32-part series reviews the...
EngageNY
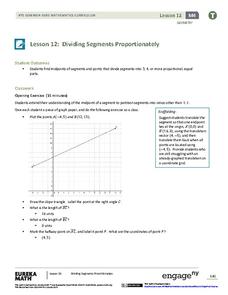
Dividing Segments Proportionately
Fractions, ratios, and proportions: what do they have to do with segments? Scholars discover the midpoint formula through coordinate geometry. Next, they expand on the formula to apply it to dividing the segment into different ratios and...
EngageNY
Distance and Complex Numbers 2
Classmates apply midpoint concepts by leapfrogging around the complex plane. The 12th lesson plan in a 32 segment unit, asks pupils to apply distances and midpoints in relationship to two complex numbers. The class develops a formula to...
Radford University
Parallel Lines Task
Transform the classroom into a coordinate plane. Scholars walk along parallel lines drawn on a coordinate plane on the classroom floor. They measure angles and slopes and use the results to develop criteria that would make the lines...
EngageNY
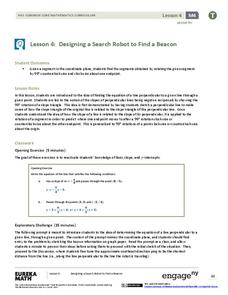
Designing a Search Robot to Find a Beacon
Build right angles using coordinate geometry! Pupils explore the concept of slope related to perpendicular lines by examining 90-degree rotations of right triangles. Learners determine the slope of the hypotenuse becomes the opposite...
Curated OER
Exploring Transformations
Students explore what happens when geometric figures are transformed on the coordinate plane. They work in pairs, moving geometric shapes in the plane, and formalize their rules as functions.
CK-12 Foundation
Vector Subtraction
Move vectors to determine their difference. Pupils use an interactive to visualize the opposite of a vector. They use the concept of adding vectors to subtract vectors by adding the opposite and, finally, view the differences of the...
Curated OER
Plotting Rectangular Coordinates
Students practice plotting coordinates on a flat surface or plane. The coordinates can be identified and labeled. An interesting variation of this process is made in the lesson when the position of holes made by thrown darts are plotted.
Shodor Education Foundation
Sequencer
Take the first step into graphing sequences. Learners set the starting number, multiplier, add-on, and the number of steps for a sequence. Using the inputs, the interactive calculates and plots the sequence on the coordinate plane. Users...
Shodor Education Foundation
Graph Sketcher
Sketch graphs with the Graph Sketcher. Scholars graph functions on a coordinate plane. An interactive makes it as easy as inputting the function and clicking a button.
Curated OER
Graphing Lines in Slope-Intercept Form
Put it in slope-intercept form! Learners solve linear equations and sketch a graph of the equation on a coordinate plane. This activity contains 12 problems and an answer key.
Curated OER
2D-Graphing Functions
Practice graphing basic equations. Algebra learners complete a table showing values of x and y. They graph the results on a coordinate grid. There are six problems: three equations are linear, and three are quadratic. The "show your...
Curated OER
Graphing Exponential Functions
Explore the concept of graphing exponential functions. High school mathematicians are given exponential functions such as y=2*3^x, and they graph them on a coordinate plane. They are given two exponential graphs and must write an...
Curated OER
Lesson 2-5: Absolute Value Functions and Graphs
What is absolute value? What is an absolute value function? Emerging mathematicians solve equations containing variables inside an absolute value sign. They graph each function on a coordinate plane and identify the maximum and minimum...
Curated OER
Solving multi-step inequalities and solving systems by elimination
Young scholars solve multi-step equations and apply the process of elimination. In this algebra lesson, students solve linear inequalities and equations using linear combination and evaluation. They graph their results on a number line...
Curated OER
Walk-A-Thon
Students graph linear http://www.lessonplanet.com/review?id=180542equations. For this problem solving lesson, students calculate slope and plot ordered pairs on a coordinate grid. Using a real-life example of a walk-a-thon, students...
Curated OER
Systems of Equations and Inequalities
This is a comprehensive lesson on creating and solving equations and systems of equations and inequalities. Problems range from basic linear equations to more complex systems of equations and inequalities based on a real-world examples....
Illustrative Mathematics
Chocolate Bar Sales
In this real-world example, algebra learners start to get a sense of how to represent the relationship between two variables in different ways. They start by looking at a partial table of values that define a linear relationship. They...
Mathematics Vision Project
Circles and Other Conics
Through a variety of hands-on activities and physical scenarios, this far-reaching unit leads learners through an exceptionally thorough exploration of circles and parabolas as conic sections. Geometric construction techniques are used...
K-5 Math Teaching Resources
Graph Paper
You'll never have to buy graph paper again with this printable resource, which can be used for anything from creating graphs, plotting points in the coordinate plane, or measuring the area and perimeter of polygons. A helpful resource...
Mathematics Vision Project
Module 4: Linear and Exponential Functions
Sequences and series are traditionally thought of as topics for the pre-calculus or calculus class, when learners are figuring out how to develop limits. But this unit uses patterns and slopes of linear functions in unique ways to bring...
Mathematics Assessment Project
Representing and Combining Transformations
Transform your learners into master geometers with an activity that asks them to first complete an assessment task drawing the result after transformation of a given shape in the coordinate plane. They then use cards to represent...
Mathematics Assessment Project
Aaron's Designs
Learners first create designs for greeting cards by applying transformations of shapes on a coordinate plane, and then determine a sequence of transformations that produces a given design.
EngageNY
Graphing the Sine and Cosine Functions
Doing is more effective than watching. Learners use spaghetti to discover the relationship between the unit circle and the graph of the sine and cosine functions. As they measure lengths on the unit circle and transfer them to a...


