Curated OER
The Research Paper - Searching for a Subject
Students research a website to look for potential topics for a research paper. They develop a narrowed prioritized subject list on an index card (3X5) using word processing program.
Curated OER
"Double Jeopardy" Class Review
Sixth graders participate in "Double Jeopardy," which is a game show type of question/answer game used to review a chapter/unit/region assessment. students use the five themes of geography as the basis for their required number of...
Curated OER
Collaboration and Communication Tools-1
Learners use telecommunications and online resources to participate in activities that develop solutions outside the classroom. They use email attachments and FAX to send their finished letters describing why people should or should not...
Curated OER
Social Studies: Canadian City Comparison
Students research Canadian population distribution while comparing and contrasting the quality of life in two cities. They discuss issues and problems that cities and rural towns face. Students apply various methods, such as graphs and...
Curated OER
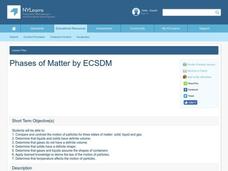
Phases of Matter
Students describe the motion of solids, liquids and gases. In this chemistry lesson, students describe how temperature affect motion of the particles. They determine the physical properties of each phase.
Curated OER
Movement, it's FUN-damental!
High schoolers discover how muscles work. For this biology lesson, students explain the causes of fatigue and muscle soreness. They create graphs and compare results with their classmate.
Khan Academy
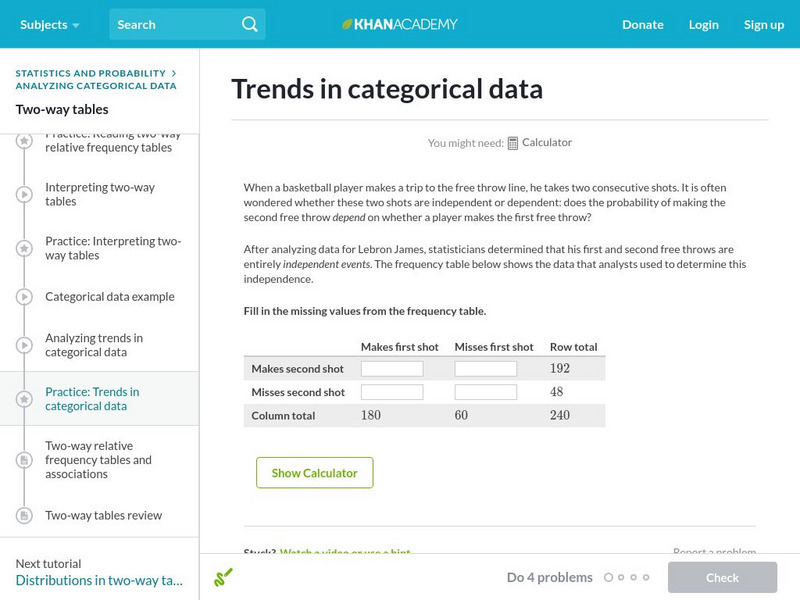
Khan Academy: Trends in Categorical Data
Analyze categorical data to find some trends. Students receive immediate feedback and have the opportunity to try questions repeatedly, watch a video or receive hints.
Yale University
Yale University: Categorical Data Examples
Site provides some different examples of categorical data and discusses the use of two-way tables.
Texas Instruments
Texas Instruments: Describing Categorical Data
Students analyze the distribution of categorical data. They calculate percents and visually compare the data sets with a bar chart.
Texas Instruments
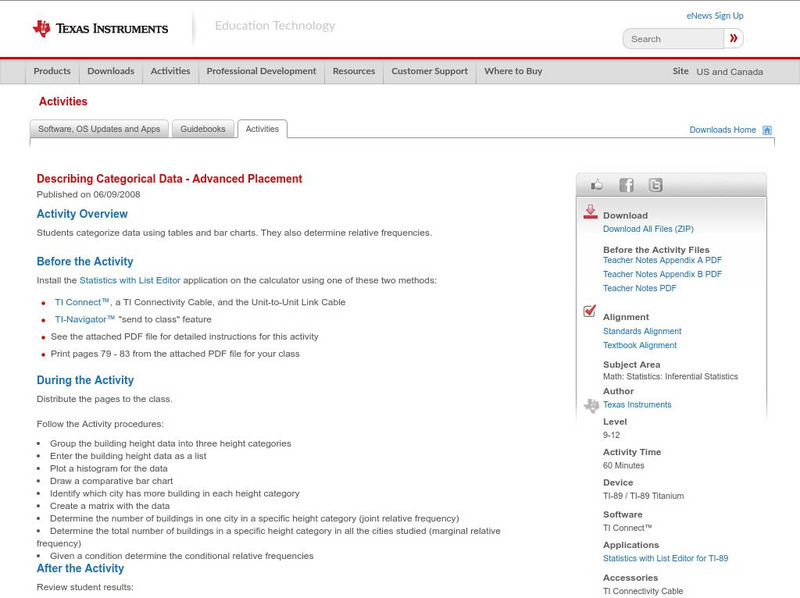
Texas Instruments: Describing Categorical Data Advanced Placement
Students categorize data using tables and bar charts. They also determine relative frequencies.
CK-12 Foundation
Ck 12: Statistics: Displaying by Type of Data Grade 8
[Free Registration/Login may be required to access all resource tools.] Create and use different data displays to analyze and draw conclusions about different sets of data.
National Council of Teachers of Mathematics
The Math Forum: Growth Creature Lab Data Collecting
Lesson plan completely explains how students will collect data on the growth of an "alligator" and determine the relationship of the growth data to the Fundamental Theorem of Similarity and to topics in geometry in general. All of the...
Other
U. Of Wisconsin: Formulating Statistical Questions and Collecting Data
This slideshow gives a detailed explanation of the characteristics of statistical questions and how they differ from other types of questions, the types of studies, and the methods for collecting data. It describes the case of Clever...
University of Georgia
University of Georgia: Inter Math: Types of Data
This site has a concise definition of "Data," plus examples of data types and collection methods.
Oswego City School District
Regents Exam Prep Center: Categorizing Data
Three lessons on different types of data (qualitative, quantitative, univariate, bivariate, biased data) as well as a practice activity and teacher resource.
Texas Instruments
Texas Instruments: And Now, the Weather: Describing Data With Statistics
In this activity, students can use a temperature probe to collect outdoor temperature readings over a day long period. They will then describe the data Using statistical concepts.
CK-12 Foundation
Ck 12: Statistics: Displaying Categorical Variables
[Free Registration/Login may be required to access all resource tools.] This Concept covers a few ways in which categorical data can be displayed; using bar graphs and pie graphs.
CK-12 Foundation
Ck 12: Introduction to Data and Measurement Issues Grades 11 12
[Free Registration/Login may be required to access all resource tools.] This Concept familiarizes students with data analysis and statistical terminology.
University of Baltimore
University of Baltimore: Types of Data, Levels of Measurement
This resource provides a discussion about the many types of statistical data and the many levels of statistical measurement. Written by Dr. Hossein Arsham
Utah Education Network
Uen: Generating and Recording Data
This "fish" activity will help early elementary students develop skills related to categorizing, recording data, developing vocabulary, and counting. An assessment rubric is attached.
CK-12 Foundation
Ck 12: Statistics: Basic Graph Types
[Free Registration/Login may be required to access all resource tools.] Organize distributions of data by using a number of different methods.
CK-12 Foundation
Ck 12: Basic Graph Types
[Free Registration/Login may be required to access all resource tools.] Students will review the different types of graphs, and the differences between discrete and continuous data, and between qualitative and quantitative data. They...
Texas Instruments
Texas Instruments: Comparing Rate of Change for Skate Rental
Students will compare charges from two skate rental shops and, using data from their lists & graphs, determine the conditions required for one shop to be less expensive than the other.
Other popular searches
- Categorical Data Worksheet
- Classify Categorical Data
- Numerical vs. Categorical Data
- Numerical vs Categorical Data


