Curated OER
Heat Energy- Temperature
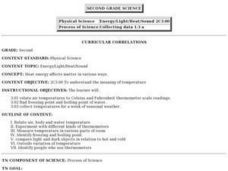
Second graders investigate the meaning of temperature. They determine what happens to a thermometer when the temperature rises or falls. They place thermometers in different classroom locations in order to compare the temperature in a...
Curated OER
Surface Air Temperature Trends of the Caribbean
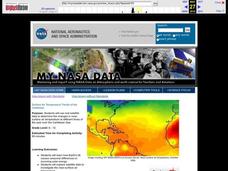
Students investigate the seasonal changes to sea surface and near-surface air temperatures near the equator. They use actual satellite data to track and graph the differences in air and sea temperatures during different seasons in the...
Curated OER
Bing! Bang! Boom!
Sixth graders investigate heat energy, conduction, convection, and radiation.
Curated OER
ALASKA-CANADA HIGHWAY PROBLEM
Students create a table of ordered pairs, using variables (dependent and independent), writing equations, converting metric and standard measurements for distance using mileposts.
Curated OER
Temperature School
Pupils observ the cooling and warming of room temperature, hot, and ice cold cans of water by measuring the change in temperature over time. They then attempt to develop explanations for the observations made and apply their findings to...
Curated OER
Canada's Climate: Temperature and Rainfall Variations
Students analyze data about various climates in Canada. In this data analysis and climate lesson, students use Canada Year Book 1999 to complete a worksheet and make connections between precipitation and temperature in different climates.
Curated OER
A Comparison of Land and Water Temperature
Students use the NASA website's Live Access Server to create a graph of surface temperature at two locations on earth. They analyze the data and then answer specific questions provided in this lesson. They also examine and compare the...
Curated OER
Sea Surface Temperature Trends of the Gulf Stream
Students use authentic satellite data to produce plots and graphs of sea surface temperature as they explore the seasonal changes of the Gulf Stream.
Curated OER
Snow Cover By Latitude
Students examine computerized data maps in order to create graphs of the amount of snowfall found at certain latitudes by date. Then they compare the graphs and the data they represent. Students present an analysis of the graphs.
Curated OER
Sea Surface Temperature Trends of the Gulf Stream
Students explore the importance of the Gulf Stream. Using a NASA satellite images, they examine the sea surface temperature. Students collect the temperature at various locations and times. Using spreadsheet technology, they graph the...
Curated OER
High School Mathematics Problems from Alaska: AL-CAN Highway Problem
Students write and solve equations converting between metric and standard measurement as they travel southeast on the Al-Can Highway.
Curated OER
Traveling to Japan: Which Way Do We Go?
Fourth graders explore the different types of ways to measure the distance between Florida and Japan.
Curated OER
Graphical Determination of Density
Young scholars determine the density of metal shot by a graphical method using significant digits in making measurements and calculations. Students graph a seris of laboratory measurements and determine density from a mass verses volume...
Curated OER
The Sun, Earth's Angles, and the Seasons
Students determine if the angle of light bombardment is a factor in heat absorption. They correlate these findings to the tilt of the Earth and the seasons. Students fold a pice of black construction paper in half, lengthwise. They tape...
Curated OER
How the Amount of Solar Energy Absorbed by the Earth is Dependent Upon the Earth's Position
Students investigate the angle of light and how it faces the earth. They conduct a series of investigations with the following two objectives. Students determine if the angle of light is a factor in the absorption of heat. They correlate...
US Energy Information Administration
U.s. Eia Energy Kids: Famous People: A. Celsius
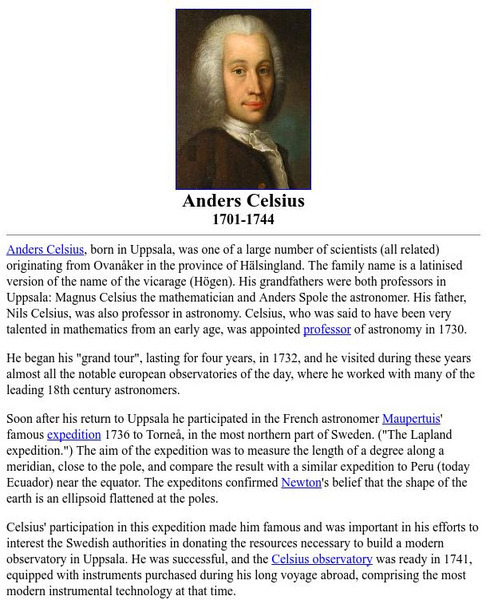
Brief biographical sketch of Anders Celsius, the Swedish scientist who developed the widely used Celsius scale for measuring temperature.
Texas Instruments
Texas Instruments: Unit Conversions
In this activity, students learn to convert temperature readings on the Fahrenheit scale to temperature readings on the Celsius scale.
Famous Scientists
Famous Scientists: Anders Celsius
Learn about the life and work of Anders Celsius, the Swedish astronomer who proposed the Celsius temperature scale which bears his name.
National High Magnetic Field Laboratory
Magnet Academy: Anders Celsius
Anders Celsius is most familiar as the inventor of the temperature scale that bears his name. The Swedish astronomer, however, also is notable as the first person to make a connection between the radiant atmospheric phenomenon known as...
PBS
Pbs: Modeling the Linear Relationship Between Fahrenheit and Celsius
Explore the relationship between degrees Fahrenheit and degrees Celsius. This video focuses on developing an expression to model the relationship between the temperature scales using a line graph to calculate slope and the y intercept.
University of Oregon
University of Oregon: Temperature Scales
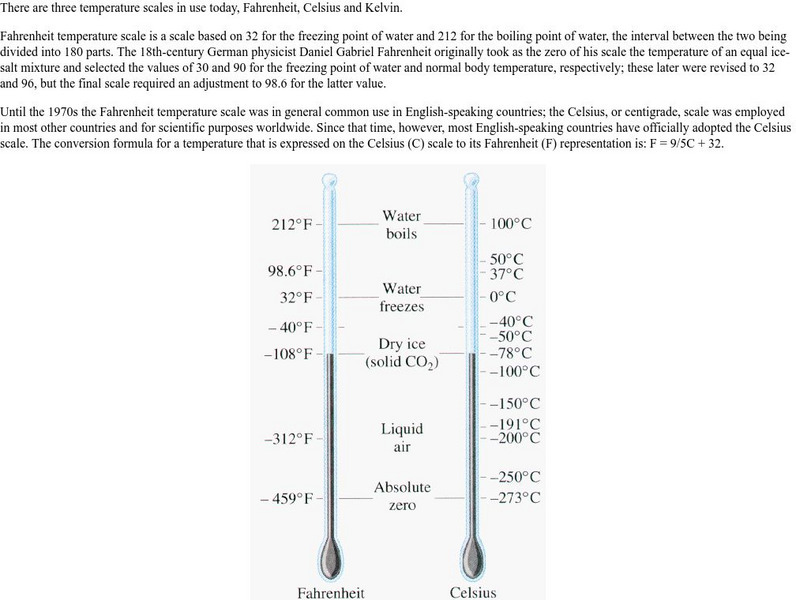
This site from the University of Oregon provides information on the three temperature scales in use today--Farenheit, Celsius, and Kelvin. Historical information is given on the discovery of the scales along with information on the...
Other
History of Astronomy in Uppsala: Anders Celsius
A lengthy account of the life and work of Anders Celsius. Describes his studies of astronomy and his development of the Celsius temperature scale.
University of Alaska
Alaska Science Forum: Daniel Fahrenheit, Anders Celsius Left Their Marks
This resource provides an account of the lives of the two scientists responsible for two of the most common temperature scales. Includes biographical information about each and a description of how each developed their own temperature...
Other
Celsius, Fahrenheit, Kelvin, Reaumur, Rankine Temperature Conversion Formulas
A resource for converting between five different temperature scales. Also provides the formulas and the temperature scale ranges.


