Curated OER
Numerical Analysis: Polynomial Interpolation
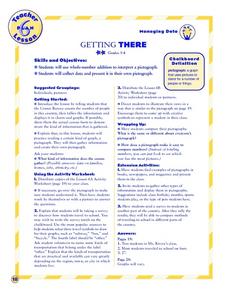
In this polynomial worksheet, students identify the interpolated and extrapolated value of given equations. This four-page worksheet contains approximately ten problems. Explanations and examples are provided.
Curated OER
Mapping Population Changes In The United States
Students create a choropleth map to illustrate the population growth rate of the United States. They explore how to construct a choropleth map, and discuss the impact of population changes for the future.
Curated OER
Population Pyramids
Students utilize population pyramids to answer questions, make comparisons, draw conclusions and support predictions about the populations of China, India and the Unites States. They arrange numbers and symbolic information from various...
Curated OER
Completing University
Students analyze the pros and cons of completing a 4 year school. In this statistics lesson plan, students complete surveys and use E-STAT to graph their data. They learn to plot and build diagrams.
Curated OER
Age and Sex
Students create and analyze a population pyramid based on age and sex data from the 2001 Census. They explain and interpret the population pyramid other students have produced.
Curated OER
Puerto Rico Pyramid Scheme
Students are introduced to the purpose of a population pyramid. In groups, they compare and contrast various population pyramids and identify trends about the civilization being examined. With a focus on Puerto Rico, they work together...
Curated OER
Eerie Indiana!
Eleventh graders research the population for ten cities in their state, in this example, Indiana, using census information. They design a spreadsheet using the data and create a bar graph with the data. They complete follow up questions.
Curated OER
Keypals and You
Students collect and compare data received from keypals. They use electronic mail to exchange information with keypals and rrite a paper comparing similarities and differences between themselves and their keypals. In addition, use a...
Illustrative Mathematics
Households
Use an inverse linear function to interpolate a point. Presented with the number of households over a period of year, pupils find a linear function that will be a model. Class members determine the inverse of the linear function and use...
Curated OER
Pop Clock
Students explore the Census Bureau's Homepage on the Internet to gather data regarding trends in population, poverty guidelines, and social characteristics between caucasians and minorities. The data is used to investigate evidence for...
Curated OER
Making Plans
Students choose site for a new school by using real life problem solving skills.
Curated OER
Count On Us: Concepts and Applications of Demography
Eighth graders use the Internet to research demographics of certain areas. They use the U.S. Census Bureau's website to help them gather information. They use their data to find a solution to a hypothetical problem.
Curated OER
Monster Graph Activity
Seventh graders engage in a instructional activity which take the fear out of graphing. They create and draw conclusions from data found in a Monster graph.
Curated OER
Enquiry 1: Introduction
Students explore war memorials from the First World War. After visiting a local war memorial, students research the soldiers listed. As a class, they discuss the the impact of the war on their community. Students research their...
Curated OER
Rationalizing Race in US History
Students consider the classification of people. In this race studies lesson, students examine the concept of race as it relates to U.S. history and trends. Students research racial discrimination and prejudice in order to support their...
Curated OER
African American Population Shifts
Students investigate population trends. In this African American history lesson plan, students access U.S. Census records from 1900 to the present online. Students analyze the migration of African Americans from one area of the U.S. to...
Curated OER
Where We Live
Students forecast future population growth of the U.S. Virgin Islands. In this U.S. Census lesson plan, students explain the factors that influence population density on the U.S. Virgin Islands, including geography and economic activity.
Curated OER
Questions for Today: Communities
Students discover how questionnaires help communities to determine the needs of its citizens. They make an analogy between a survey of students about their school and a survey of citizens about their community.
Curated OER
Population Counts
Students investigate the analytical processes used to interpret the 2001 Canadian census. They examine the population statistics and trends.
Curated OER
Picture a Nation
Learners research immigration data from a specific time period. They create a graphic organizer that depicts the information and share the information with the class.
PBS
What We Do Adds Up
With so many tons of trash going into landfills each year, your environmentalists can calculate how much the average person is tossing away. This activity has a series of questions not only requiring math, but a conscious thought of how...
Curated OER
Slavery by the Numbers
Students examine the role of slavery in the United States. In this American history instructional activity, students watch segments of the video "Slavery and the Making of America." Students conduct further research pertaining to Thomas...
Curated OER
The People of Kansas: Where Did They Come From and Why Did They Come?
Pupils research and discuss the reasons why early settlers emigrated to Kansas. They, in groups, analyze census district reports from the 1850's and then identify the advantages and disadvantages of using this information as research.
Curated OER
Chief Joseph and the Nez Perce
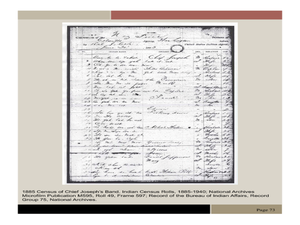
Eleventh graders explore the life of Chief Joseph and Nez Perce. In this US History lesson, 11th graders analyze paintings and photos detailing the flight of Nez Perce. Students create a narrative newspaper article based on their...
Other popular searches
- Data, Census, & Statistics
- Analyzing u.s. Census Data
- Analyzing Census Data
- Data Census & Statistics
- Graphing Census Data
- United States Census Data
- Graphing Using Census Data
- 2010 Census Data
- Census Data 1860s
- Historical Census Data Browser
- Analyzing Us Census Data
- Data Census


