Bowland
Fashionista
So trendy! Show your class how to identify trends in sales patterns using mathematics. Scholars use a software simulation to collect data on age groups, price, and sales at a fashion store. This data allows individuals to determine the...
National Endowment for the Humanities
African-American Communities in the North Before the Civil War
Middle schoolers may be surprised to learn that before the American Civil War there were more slaves living in New York than there were in Kentucky! Young historians examine maps and census data to gather statistics about...
Curated OER
Numbers Tell a Story
Learners connect census data to historical events. In this civics lesson plan, students understand cause and effect, and how they are reflected in census data and analyze census data for social and economic significance.
Curated OER
Using Real-Data from North Dakota to Study Place Value, Rounding, Estimation, Fractions, and Percents
In this real-data activity, students use data from the 2008 Census Bureau to answer eight questions divided into four activities. The topics covered include: place value, rounding, estimation, fractions, and percents.
Curated OER
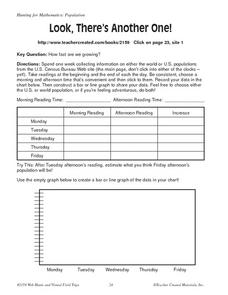
Look, There's Another One!
In this math worksheet, learners spend a week collecting information on either the word or U.S. populations from the U.S. Census Bureau Web site. Students record their data in a chart and bar graph. Learners also use the website to...
Curated OER
Ohio Census 1990 and 2000
Students explore the Ohio census numbers in 1990 and 2000. In this social studies lesson, students use the census data to answer questions.
Curated OER
Student Census
Students collect data from their peers and store the information in a database. As students manage the information they realize the usefulness of a database as a tool to manage large amounts of information in an efficient and accurate...
Curated OER
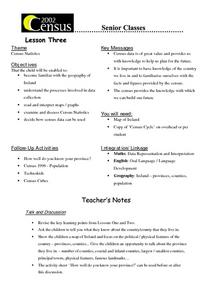
Census Statistics
Twelfth graders become familiar with the geography of Ireland. They explore the processes involved in data collection. Students examine and discuss Census Statistics and read and interpret maps/graphs. They decide how the census data can...
Curated OER
Redistricting: Drawing the Lines
Difficult redistricting concepts are covered in a context that will make it understandable to your government scholars. They begin with a KWL on the term redistricting and then watch a video to answer some questions. They analyze...
Curated OER
Then and Now
Learners conduct research and use census data to compare different times and places. In this census lesson, students interpret data from charts and graphs, comparing census information from two time periods as well as from two different...
Curated OER
The Demise of the Great American Frontier
Students are introduced to Frederick Jackson Turner and how early Census data, when combined visually with maps, effectively demonstrated the end of the frontier.
Curated OER
From Data to Drinks - My Marketing Plan
Students research and discuss how Canada's aging population affects advertising. They record information from the 2001 census and create a marketing plan to sell a soft drink.
Curated OER
Making Plans
Students gain an understanding of the U.S. Census. In this civic lesson plan, students use real-life problem-solving skills and census data to choose a site for new school.
Curated OER
Time Changes Everything
Students analyze census data from 1915, 1967 and 2006. They read an article about how the world's population is growing at an alarming rate. They use primary source documents to create a timeline on the information they gathered. They...
US Department of Commerce
Apportionment: Grades 3-4
Apportionment is a big word for young pupils. Use a helpful cartoon video and worksheet with data set to help them understand how the census fuels representative democracy. After examining how the census determines the number of seats a...
American Statistical Association
Bear Hugs
Scholars research arm span to determine who gives the best bear hugs. They use data from a national study to find the standard statistics for arm span. It includes mean, median, quartiles, spread, standard deviation, and more.
Curated OER
Data Collection
Students explore the reason for collecting and analyzing facts and figures or data and statistics. They show how data can be used to help us to solve real life problems and plan for the future. Students use everyday problems that can be...
Curated OER
Mapping the Census
Students learn why the census makes a difference. In this U.S. Census lesson plan, students learn the key elements of cartography, examine the difference between data and their representation, and create a map using census data.
Curated OER
It's Census Time: Census Lesson Plans
Census lesson plans can provide an interdisciplinary look at how the data is used, and what it means for everyone.
American Statistical Association
Armspans
Young mathematicians collect data on the arm spans of classmates. Then they sort the data by measures of center, spread, and standard deviation. Finally, they compare groups, such as boys and girls, to interpret any differences.
Curated OER
Was There an Industrial Revolution? New Workplace, New Technology, New Consumers
High schoolers examine the changes in the U.S. in the period of industrialization before the Civil War. They analyze census data, list/describe inventions and innovations, explore various websites, conduct a Factory Simulation activity,...
US Department of Commerce
Applying Correlation Coefficients - Educational Attainment and Unemployment
Correlate education with unemployment rates. Individuals compare state and regional unemployment rates with education levels by calculating the correlation coefficient and analyzing scatter plots. Pupils begin by looking at regional data...
Curated OER
What's in a Number? Analyzing Smoking Statistics
Sixth and seventh graders analyze smoking statistics. In this health lesson, learners look at the percentage of people who smoke from each race group. They create a bar graph and circle graph that displays this information.
Curated OER
Where Do I Live?
Young scholars gain a better understanding of the population of the region they live in by comparing U.S. census data on the internet.
Other popular searches
- Data, Census, & Statistics
- Analyzing u.s. Census Data
- Analyzing Census Data
- Data Census & Statistics
- Graphing Census Data
- United States Census Data
- Graphing Using Census Data
- 2010 Census Data
- Census Data 1860s
- Historical Census Data Browser
- Analyzing Us Census Data
- Data Census


