Curated OER
Taking an Animal Census Grades 3-8
Students comprehend the competitive, interdependent, cyclic nature of living things in an environment. They conduct an animal census in a designated research area over a six-month period to determine what types of species are present,...
Curated OER
2006 Census Teacher's Kit: Web of Consequenses
In this data analysis worksheet, students use a graphic organizer to show the things that have changed over the years and the consequences of these changes using the 2006 Census data. Students show the changes and direct consequences in...
Curated OER
Population Pyramids
Learners work with and make population pyramids. In this population pyramid lesson, students use census data to make population pyramids for China, India, and the United States. They use the information to determine why jobs are leaving...
Curated OER
Entrepreneurship: Will it Work?
Consider to possibility of starting a business as a way to examine the concept of entrepreneurship. Learners develop and analyze feasibility studies, marketing strategies, proposals, and local census data all needed when starting a small...
Curated OER
Classroom Census
Students identify the processes involved in data collection. They decide how census data can be used. Students engage in the data collection process and represent and interpret classroom data. They use scattergrams, arrow diagrams, block...
Curated OER
Senior Classroom Census
Students recall the data collection cycle and engage in the data collection process. They record data, represent it in graphical form and anlyze and question the data. In addition, they decide how census data can be used for
planning.
Curated OER
2006 Census Teacher's Kit: Consequences Report Card
In this analyzing the Census learning exercise, students assess the consequences of change using data from the 2006 Census. Students analyze the economic, social, and political wellbeing of each stakeholder.
Curated OER
Neighborhood statistics
Students examine statistics relating to neighborhoods. They use the data to explain how a population affects their environment. They discuss how businesses use statistics to find out information about their clientele.
Curated OER
Arthur Young and the President
High schoolers work with NASS data by converting it into prose. For this historical agriculture information lesson, students read about how George Washington communicated information about crop yields, livestock, and land values. They...
Curated OER
Exploring Our Country: An United States Scavenger Hunt
Young scholars visit a selected web site and search answers to given questions. They investigate census data for a several states. They explore data such as business, geography, and people. Students demonstrate ways to navigate...
Curated OER
District Decisions
Students review census data and examine the manner in which reapportionment and redistricting occurs. They, in groups, debate a proposed change in the way congressional districts are drawn and present their debates to the class.
Curated OER
The Hispanic Migration into Iowa
Sixth graders examine the positive and negative effects of the migration of people of Hispanic descent in the state of Iowa. They examine and interpret census data using maps before comparing the positives and negatives. They read...
Curated OER
Fill in Your Future
Students discuss the Census 2000 slogan, "This is Your Future. Don't Leave It Blank." They design billboards for the slogan. They discover the role of the census in community planning and congressional representation.
Curated OER
Teenage pregnancy trends in Canada
Young scholars analyze demographic data relating to teen pregnancy trends. They develop skills to locate and interpret data. They discuss the factors that influence teenage pregancy such as social, economic, and educational issues.
Curated OER
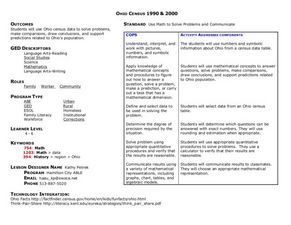
Ohio Census 1990 & 2000
Students use Ohio census data to solve problems, make comparisons, draw conclusions, and support predictions related to Ohio's population. They interpret and work with pictures, numbers and symbolic information.
Curated OER
Ohio Census 1990 and 2000
Students begin the lesson by examining Census data from the state of Ohio from 1990 and 2000. Using a worksheet, they solve problems using the data and a calculator. They share their responses with the class and discuss what the data...
Anti-Defamation League
The Gender Wage Gap
"Equal pay for equal work!" may sound logical but it is not the reality. High schoolers begin a study of the gender wage gap with an activity that asks them to position themselves along a line that indicates whether they strongly agree...
Curated OER
Mapping Districts
Students become literate in their use of maps. In this 2010 Census lesson plan, students visualize census data on maps, use map keys to read population maps, and explore the concept of population density.
Curated OER
Mapping Districts
Students use maps to learn about the U.S. Census. In this 2010 Census lesson plan, students visualize census data on maps, use map keys to read population maps, and explore the concept of population density.
Curated OER
Analysing 2001 Census Microdata
Eighth graders examine the census data of 2001. In this American History lesson, 8th graders analyze data using one- and two-variable statistical analysis. Students develop a research question that makes use of the microdata.
Curated OER
Cities
Students examine U.S. Census figures. In this urban centers lesson plan, students compare city populations across the span of 50 years. Students create line graphs based on the data.
Curated OER
Jobs in Jamestown
Students research occupations of Jamestown settlers using census data, and evaluate the data to show the needs and activities of the colony.
Curated OER
Technology - Data Collection
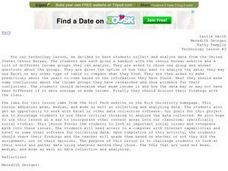
Students collect and analyze data from the United States Census Bureau. Using spreadsheet technology, students explore their results and make preductions about income groups. Students compute the mean, median and mode. They create...
Curated OER
Hi, Deer!
Students collect, organize by table, and examine census data in a simulation, estimate the size of the population in the simulation and make predictions based on the collection of census simulation data.
Other popular searches
- Data, Census, & Statistics
- Analyzing u.s. Census Data
- Analyzing Census Data
- Data Census & Statistics
- Graphing Census Data
- United States Census Data
- Graphing Using Census Data
- 2010 Census Data
- Census Data 1860s
- Historical Census Data Browser
- Analyzing Us Census Data
- Data Census


