Curated OER
Jamestown Changes
Students examine how the Jamestown settlement changed the first few years after it was founded. They take a virtual field trip of Jamestown, read primary source documents, discuss census information, and write a summary of changes in...
Curated OER
Fish Stix
Students explore population biology. They describe and demonstrate
a visual census technique commonly used to survey reef fish populations. In addition, they analyze and interpret data from surveys of coral reef fish populations.
Curated OER
The Survey Says
Young scholars experience the development of statistical data. In groups, they construct a survey questionnaire for a target audience. Students produce the questionnaire, distribute it, collect it, and tabulate the data. Using EXCEL,...
Curated OER
How does Your Province Stack Up?
Students investigate data about age, and sex of a population. In this statistics lesson, students are given data on a population to analyze and compare to other provinces. This assignment is part of a geography lesson and requires 3...
Curated OER
Jobs in Jamestown
Students research data on Jamestown settlers in order to learn about the daily life and events in the colony. In this investigative history lesson, students work in groups to analyze the results of the Jamestown census. Students take...
Curated OER
Identifying potential target markets
Students analyze data. In this secondary mathematics lesson plan, students identify the demographic, geographic, and socio-economic characteristics of potential target markets for planned goods and services. Students identify and...
Curated OER
Aboriginal Peoples
Middle schoolers examine data from the 2001 Census on the Aboriginal population. They cover the topics of distribution of the Aboriginal population across the country, the three Aboriginal groups, age, and language. Students build...
Curated OER
Where You Belong
Students identify different groups to which they belong, and use counting techniques to take a census of their family and class.
Curated OER
Graphs! Graphs! Graphs!
Students practice making charts and graphs from data on spreadsheets. Individually, they create a graph representing the latest information on voter registration. They answer questions and analyze the data to end the lesson.
Curated OER
Teachers' Notes: Switch Gets Ready!
Students practice multiplication facts, answer simple math questions from two, five, and ten times-tables, explore concept of halves and quarters, complete worksheet containing range of shapes to make shape picture, and sort data and...
Curated OER
Upper class black society during Jim Crow
High schoolers investigate upper class black society during the Jim Crow era by reading primary resources (newspaper articles, census data, photographs). They summarize and organize information on specific citizens in chart form.
Curated OER
Kids Count
Students read special purpose map, use place value to hundred thousands, and write numbers to hundred thousands.
Curated OER
Populations in the Path of Natural Hazards
Learners read "Geographical Mobility: 1995-2000." They examine the maps in the handouts and compare them with maps from an atlas. In the second part of this instructional activity, students read "In Harm's Way." They receive three more...
Curated OER
Technology Integration Lesson Plan: Texas Congressional Delegates
Eighth graders research congressional delegates from state of Texas, create database including delegate profiles, write introductory paragraphs on how census affects Congressional representation, and import information into word...
Curated OER
Censusmania
Students discover the meaning of census, discuss the 2000 census, and the importance of filling out the form and returning it to the census bureau. They review the census sheet from New Castle County in 1850, observing the headings of...
Curated OER
Censusmania
Students understand how the census can reveal information about people and history. They create their own census.
Curated OER
Jobs in 1860 and Today
Students compare occupations during the 19th century with the 21st century using information from 19th century census information.
Curated OER
The Effect Of Transportation Systems On The Early Economic Development Of Indiana's Counties
Twelfth graders analyze the impact of transportation systems on the early economic development of Indiana's counties. They examine U.S. Census records, analyze data, and prepare a graphical depiction of the rates at which sample...
Global Oneness Project
Citizen Photojournalism
Matt Black's photo essay, "The Geography of Poverty" provides a shocking reminder of the poverty that exists in the United States. The resource not only focuses attention on poverty but also conditions that have given rise to situation...
Curated OER
The ABC's of Apportionment
Students are introduced to the terms of apportionment and redistricting. Using a Census map, they identify the states that had the highest and lowest numbers of change during the past ten years. They examine a map of voting districts and...
Curated OER
How Much is There to Eat?
Students examine food production related to population density. In this interdisciplinary lesson, students gather data regarding food production in the American South and in India. Students follow the outlined steps to calculate the...
Curated OER
Mapping Population Changes In The United States
Students create a choropleth map to illustrate the population growth rate of the United States. They explore how to construct a choropleth map, and discuss the impact of population changes for the future.
Curated OER
Population Pyramids
Students utilize population pyramids to answer questions, make comparisons, draw conclusions and support predictions about the populations of China, India and the Unites States. They arrange numbers and symbolic information from various...
Curated OER
Completing University
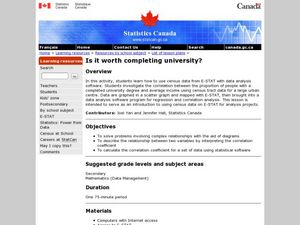
Students analyze the pros and cons of completing a 4 year school. In this statistics lesson plan, students complete surveys and use E-STAT to graph their data. They learn to plot and build diagrams.
Other popular searches
- Data, Census, & Statistics
- Analyzing u.s. Census Data
- Analyzing Census Data
- Data Census & Statistics
- Graphing Census Data
- United States Census Data
- Graphing Using Census Data
- 2010 Census Data
- Census Data 1860s
- Historical Census Data Browser
- Analyzing Us Census Data
- Data Census


