Curated OER
Lesson #46: Bar Graphs and Line Graphs
In this bar graphs and line graphs worksheet, students interpret bar graphs, line graphs, and box-and-whisker plots. They find the measures of central tendency. This three-page worksheet contains notes, vocabulary, and approximately 10...
Curated OER
Disease and Epidemics
Explore how the study of diseases and epidemics can be comprehended from a mathematical perspective. Investigate finite geometric series, calculating threshold values, and statistical models of the spread of disease. How many makes it an...
Curated OER
Going Up Or Coming Down
Students find the percent of increase or percent of decrease. Through a teacher demonstration, they examine the methods of calculating percentages. Students solve real life problems.
Curated OER
Elizabeth Cady Stanton
Students recognize that all people have rights and should be treated equal, describe some ways that women's rights have changed through time, and identify the contributions Elizabeth Stanton has made to womens' rights.
Curated OER
Euler's Method and the S-I-R Model of Disease
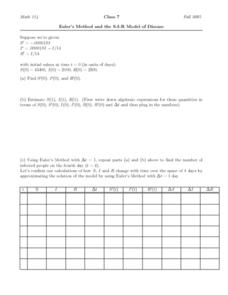
In this Euler's method worksheet, students determine algebraic expressions for quantities in given terms. Next, they use Euler's Method to identify the information. Lastly, they confirm their calculations through the S-I-R method. ...
Curated OER
Understanding Line Graphs
In this line graphs activity, 4th graders study a line graph with time and height and points A-D. Students answer four short answer questions relating to the line graph.
Curated OER
Using an Amortization Table
Students search the Internet to find a site that contains an amortization table and make a hypothesis about the results of changing time and rate. They examine the affects of time and rate on a mortgage and discuss the difference in the...
Curated OER
Lab 2: Drag Racing
In this lesson, students, Analyze the relationship between velocity and acceleration * Calculate an object's average acceleration * Collect data and interpret it* Create and analyze a graph showing acceleration.Students also work in...
Curated OER
Waste Watchers
Students recognize the importance of saving energy to save natural resources. In this saving energy lesson, students complete a worksheet to find types of electricity meters in their homes. Students use meter readings to calculate energy...
EngageNY
Graphs of Exponential Functions
What does an exponential pattern look like in real life? After viewing a video of the population growth of bacteria, learners use the real-life scenario to collect data and graph the result. Their conclusion should be a new type of graph...
EngageNY
Graphs of Piecewise Linear Functions
Everybody loves video day! Grab your class's attention with this well-designed and engaging resource about graphing. The video introduces a scenario that will be graphed with a piecewise function, then makes a connection to domain...
Curated OER
Radiation Comparison Before and After 9-11
Using the NASA website, class members try to determine if changes could be detected in cloud cover, temperature, and/or radiation measurements due to the lack of contrails that resulted from the halt in air traffic after the attacks of...
Curated OER
Grammar Practice: Choosing Between Fewer and Less
When should you use "fewer" instead of "less?" Reinforce this grammatical nuance in your class with this handy reference sheet. A short explanation guides students through the process of choosing one word over the other, and a series of...
Curated OER
Loan Amortization - Mortgage
Upper graders explore the connection between interest and principal. They use an amortization schedule to determine the amount of principal paid vs interest on a $100,000 home loan. Fourteen discussion questions and a research-based...
Berkshire Museum
Adopt a Schoolyard Tree
Help young scientists connect with nature and learn about trees with a fun life science lesson. Heading out into the school yard, children choose a tree to adopt, taking measurements, writing descriptions, and drawing sketches of it in...
Willow Tree
Bar Graphs
Circles, lines, dots, boxes: graphs come in all shapes in sizes. Scholars learn how to make a bar graph using univariate data. They also analyze data using those bar graphs.
Curated OER
Teaching Reading Comprehension through Social Studies Readings
Examine how immigrants have changed the environment of the United States. Individually, middle schoolers will take a pre- and post-test to assess their reading comprehension. In groups, they compare and contrast the religions of...
Curated OER
Timed Multiplication Test Graphs
Students use the tools of data analysis for managing information. They solve problems by generating, collecting, organizing, displaying histograms on bar graphs, circle graphs, line graphs, pictographs and charts. Students determine...
Curated OER
Math: Counting on Others
Students use counting skills to decide who wins the Classroom Winter Games. They use numeral writing and tally marks to keep score. Students have an opportunity to pretend they are competing for medals in the Winter Games while using...
Curated OER
Math: Who Makes an Epidemic?
Students calculate the threshold value for the number of susceptible people needed to create an epidemic. They examine a real life flu epidemic and use the SIR model to solve the problems. Students discover they can use mathematics to...
Curated OER
Gender Equity in the Classroom
Students review employment statistics and wages over the past 20 years. They examine the Federal Work Force Laws. They apply formulas to find the rate of change in the minimum wage.
Curated OER
Growing Rock Candy
Students observe the growth of rock candy. In this crystal growth lesson, students make rock candy and measure the crystal growth over five days.
Curated OER
Cooking Up Fractions
Middle schoolers study fractions through recipes. They rewrite recipes multiplying and changing numbers. They research the Internet for recipes and rewrite fractions to indicate a particular serving. They rewrite directions to change the...
Curated OER
Science: When Autumn Leaves Fall
Students conduct Internet research to discover the reason why leaves change color in autumn. On a nature walk around school grounds, they collect leaves of various colors and shapes over a three-week period. finally, students select...


