Curated OER
Relating Fractions, Decimals and Percents
Students convert numbers to fractions, decimals and percents. For this conversion lesson, students convert fractions, decimals and percents to a specified form. Groups of students play a conversion index card game. A worksheet, game...
Curated OER
Interpreting Line Graphs
Fifth graders interpret line graphs. In this graphing lesson, 5th graders first begin by reviewing the difference in bar and line graphs and what they are used for. Students practice interpreting the data on various line graphs and using...
Curated OER
Fishy Frequencies
Tenth graders demonstrate that natural selection is an agent of evolution. They quantitatively apply the Hardy-Weinberg Principle to an imaginary population of fish. They utilize math and graphing skills, collecting and analyzing data,...
Curated OER
Data Analysis and Probability
Students make their own puzzle grid that illustrates the number of sit-ups students in a gym class did in one minute, then they make a histogram for this same data. Then they title their graph and label the scales and axes and graph the...
Curated OER
What's The Scoop?
Learners explore the properties of matter. In this cross curriculum three states of matter science instructional activity, students listen to the poem "Eighteen Flavors" by Shel Silverstein, and predict what will happen if listed...
Curated OER
AP Calculus Practice Exam: BC Version - Part A
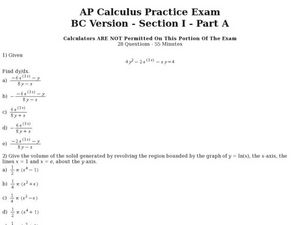
In this calculus worksheet, students solve 28 multiple choice problems. Students find derivatives, volumes, limits, convergent series, etc.
Curated OER
Calculus Practice BC
In this calculus worksheet, students solve functions using the derivatives. They calculate the volume where the graph is revolving around the x-axis, a line, the y-axis and where x=e. There are 28 questions.
Curated OER
AP Calculus Practice Exam
In this calculus worksheet, students solve functions by taking the derivative of the equations. There are 28 questions using logs and trig functions.
Curated OER
US Geography, The Blues
This lesson enables teachers to use blues styles and performers to think about various geographical regions of the United States. By studying different blues styles from the Mississippi Delta, Texas, and the Piedmont region of the...
Curated OER
What Did It Cost 100 Years Ago?
Students compare prices of good across the century in order to introduce the topic of inflation. They undertand the concepts of inflation and Consumer Price Index (CPI), use online calculators to figure the approximate cost of goods...
Curated OER
Which Amusement Park Would You Choose?
Students analyze data related to amusement parks and create a spreadsheet to display the data. They read the data and predict which amusement park they think is safer, create a spreadsheet and graph, and write a proposal based on their...
Curated OER
Archaeobotany
Students study pictures of seeds and the conditions in which they grow during their study of archaeobotany. They infer ancient plant use by looking at archaeobotanical samples. They determine the change of plant use by interpreting a...
Curated OER
Linear Modeling: Functions
Students analyze linear functions. In this algebra lesson, students create a linear model to relate coordinate pairs. They evaluate and solve equations.
Curated OER
Tides of Change
Students use the Internet to gather information on tides and then use this information to determine the period of revolution of the moon around the earth (part 1) and the relative pull of the sun and the moon on the tides (part 2).
Curated OER
Circle Graphs
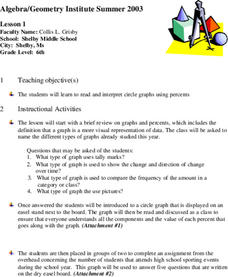
Sixth graders participate in a lesson that covers the reading and interpretation of a circle graph. They review the part of a whole concept for percents and student observe and practice using the circle graph.
University of Wisconsin
Fraction Rules
Both a reference sheet and skills practice worksheet, this handout on common fraction rules reviews steps for adding, subtracting, multiplying, and dividing fractions. Twenty examples are provided to demonstrate these skills, and...
Curated OER
I Wonder How Fast Manduca Grows...
Learners create a graph showing the growth of their manduca since it hatched. They make their own predictions about how it will grow. They answer questions to end the lesson plan.
Curated OER
Parts of a Spreadsheet
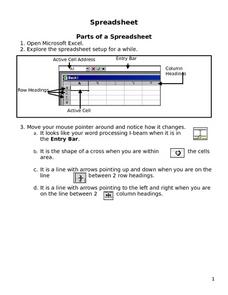
Students experiment with the basic functions of a spreadsheet. They practice using headers, footers, functions and fonts. They also organize information.
Curated OER
NUMB3RS Activity: Chains and Pyramids
Watch an episode of the TV show, NUMB3RS and then explore the mathematics of chain letters and pyramid schemes, both of which involve geometric progressions and exponential growth. They discuss why both are dangerous and illegal.
Curated OER
Striking a Balance
High schoolers participate in an activity that demonstrates the principles and dynamics of food chains. They discover that the sun's energy is captured by individual plants and transferred to animals.
Curated OER
The Hudson's Ups and Downs
Even rivers have tides. Older elementary schoolers will discuss the Hudson River and how weather, water craft, and the ocean cause tidal fluctuation. They will examine a series of line graphs that depict tidal fluctuation, then analyze...
Curated OER
Investigation Can You Build This?
Pupils work in small groups to explore spatial relationships while building with color cubes. Students must identify positions of blocks to partner, recreate a model, and color a sketch of their structure appropriately.
Curated OER
Teddy Bears and Friends
Children begin by making direct comparisons between objects and putting a number of objects into order according to length. They are also introduced to measuring with multi-link cubes which allows them to compare objects which cannot be...
Illustrative Mathematics
Bike Race
A graph not only tells us who won the bike race, but also what happened during the race. Use this resource to help learners understand graphs. The commentary suggests waiting until the end of the year to introduce this topic, but why...


