Curated OER
The Coyote Population: Kansas Prairies
Students discover animal lifestyles by researching their ecosystem. For this animal statistics lesson, students research the geography of Kansas and discuss the reasons why wild animals survive in the open Kansas fields. Students...
Curated OER
Area and Measurements
Students measure the area using feet and yard. For this algebra lesson, students draw and manipulate shapes to calculate the area. They measure the relationship of area between the two units.
Curated OER
Trail Mix
Third graders, given the price of different ingredients, make a trail mix of five different items without exceeding their budget of five dollars. They choose between pretzels, M&M's, twizzlers, popcorn, etc,. Each student practices...
Curated OER
Calculus at the Battle of Trafalgar
Students read an article on how calculus is used in the real world. For this calculus lesson, students draw a correlation between the Battle of Trafalgar and calculus. The purpose of this article is the show everyday uses for calculus in...
Curated OER
Transforming Food Energy: A Balancing Act
Students explain their role as consumers. They use a purchased calorimeter or make their own simple calorimeter to measure the energy content in selected foods. This interesting lesson really gets students thinking about what they eat.
Curated OER
Estimating
In this estimating worksheet, students review how to estimate and round numbers. Students then estimate the three number addition problems by rounding the numbers to the nearest hundred. Students then find the exact answer. Students...
Curated OER
Penny Drops Experiment
In this experiment worksheet, students perform an experiment to answer the question of how many drops of water a penny can hold. This worksheet contains the hypothesis, materials, procedure, data, data analysis, and conclusion questions.
Curated OER
Space Age Technology Comes to Earth
Young scholars explore jobs related to agriculture. In this technology/agriculture lesson, students recognize the importance of natural resources and agriculture on the use of Range Rambler software. Young scholars complete an experiment...
Curated OER
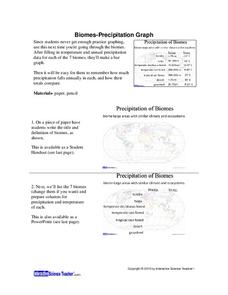
Biomes: Precipitation Graph
Students practice graphing by studying biomes. In this precipitation lesson, students graph the precipitation patterns for the 7 biomes on Earth. Students view a PowerPoint presentation in class which explores the 7 biomes and the...
Curated OER
Stupid Quiz
Students listen and discuss word problems that promote students to demonstrate logical reasoning. In this logical reasoning lesson plan, students discuss 10 word problems.
Curated OER
The Lake Effect
Fourth graders conduct an experiment demonstrating the effects of water and air temperature on precipitation. They create graphs demonstrating their findings using Claris Works for Kids.
Curated OER
Heating the Atmosphere
Students construct a thermograph for maximum and minimum temperatures for the 2-week period. They illustrate how the earth's atmosphere is heated by convection and conduction currents and evaporation of water.
Curated OER
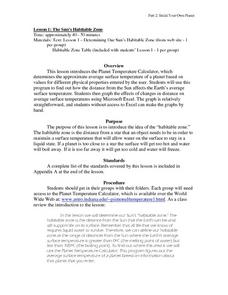
The Sun's habitable Zone
Students explore the average surface temperature of planets. They use the Planet Temperature Calculator to find the average temperature. Students explore how the distance from the sun affects the Earth's average surface temperature. They...
Curated OER
Counting on Measurement
First graders explore measurement. They measure by counting non-standard units. Students use a variety of non-standard units to predict and measure volume of various containers using rice.
Curated OER
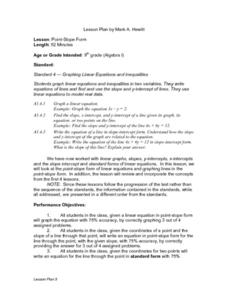
Point-Slope Form
Ninth graders explore the point-slope form of linear equations and graph lines in the point-slope form. After completing the point-slope equation, they identify the slope of a line through a particular point. Students explain the...
Curated OER
Fossil Fuels and Its Effects On The World
Students explore the effects of a declining fossil fuel system would have on the world. They read the line graph and other information to answer questions about fossil fuels. Students use mathematics to analyze graphical data and...
Curated OER
Inequalities lesson 4
Seventh graders graph solutions for inequalities on a number line. They solve problems combining like terms inequalities in one variable. Students check solutions to combining like terms inequalities in one variable.
Curated OER
The Renaissance
In this Renaissance instructional activity, students read a 2 page article covering The Renaissance period, answer 5 facts with multiple choice answers and answer 5 statements true or false.
Curated OER
Plasmasphere
For this plasmasphere worksheet, students determine how long the plasmasphere takes to rotate around the Earth using two satellite images taken three hours apart.
Curated OER
Graph Made Easy-Pre Test Questions
In this graphing pre test worksheet, students complete a set of 10 multiple choice questions. Page is labeled as a pretest, an answer link is provided.
Curated OER
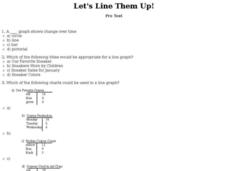
Let's Line Them Up!
In this line graph worksheet, students read through the problems about graphing and line graphs. Students select the best answer to solve the 10 online questions.
Curated OER
Students Analyze Data With Scatter Plots
Scatter plot lessons can help students create different types of graphs by hand or with the aid of technology.
Curated OER
Geography Overview
Second graders look at the United States often over the next few months. Help them to see how the United States has changed as territories have become states. They may be surprised to know the areas of our country that were territories...
Curated OER
Moving Magnetic Filaments Near Sunspots
In this sunspots worksheet, students observe two images taken by a solar observatory over a certain amount of time. Students determine the changes in the pictures and then calculate how fast and in what direction the particles are...


