The Math League
The Math League: Using Data and Statistics
This site contains two short examples of line graphs, charts that show change over time. This is a quick introduction to the topic of statistical graphing.
PBS
Pbs: The Lowdown: What You Need to Know About Immigration Reform
Interpret graphs showing changes over time in the percentage of foreign-born US residents and in annual deportations in this interactive from KQED. In the accompanying classroom activity, students use the interactive and look at how...
PBS
Pbs: The Lowdown: Poverty Trends: What Does It Mean to Be Poor in America?
Use math to learn about changes in US wealth distribution and poverty rate over time in this interactive from KQED. In the accompanying classroom activity, students interpret the graphs and consider how the poverty rate spike following...
PBS
Pbs: The Lowdown: Made in America: The High Cost of Fashion
Investigate data on changes over time in where our apparel is made and how much we spend on it in these images from KQED. In the accompanying classroom activity, students use the interactive and graph the data. They also look for...
Khan Academy
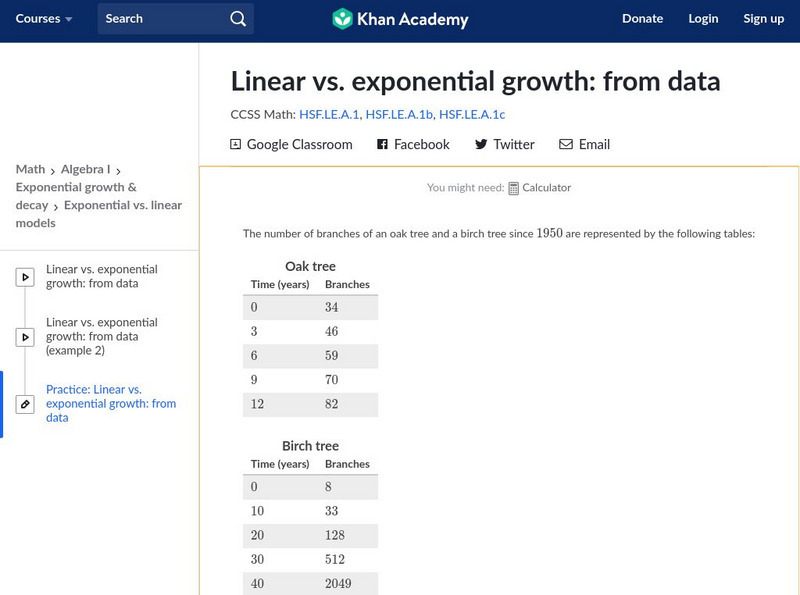
Khan Academy: Algebra I: Linear vs. Exponential Growth: From Data
Given a table with values of two quantities over time, determine whether the quantities grow linearly or exponentially. Students receive immediate feedback and have the opportunity to try questions repeatedly, watch a video or receive...
PBS
Pbs Learning Media: Pre K 12 Resources for New School Routines: Family Storytelling Bingo: Pre K and K
These weekly activities are cross-curricular but emphasize Social-Emotional Learning, Math, and Literacy development. This week, we are learning about how our family changes and stays the same over time.


