Curated OER
Worksheet 20
In this math learning exercise, students Investigate the structure and function of how the numbers of people infected with HIV changes over time. They answer the fact of it either increasing or decreasing.
Curated OER
Aging & Body Changes
Students complete several activities that have to do with aging. In this body changes lesson plan students take group averages, measure flexibility and see their changes over time.
Curated OER
Changing Images of Childhood in America: Colonial, Federal and Modern England
Students compare and contrast maps of New Haven, Connecticut from today and the past. After taking a field trip, they draw sketches of the types of architecture and discuss how the buildings have changed over time. They read journal...
Inside Mathematics
Squares and Circles
It's all about lines when going around. Pupils graph the relationship between the length of a side of a square and its perimeter. Class members explain the origin in context of the side length and perimeter. They compare the graph to the...
Balanced Assessment
Vacation in Bramilia
This performance task gives the population model of different types of flies and asks scholars to analyze the two populations. After interpreting the functions individually, participants compare the two populations and find the time when...
Kenan Fellows
Climate Change Impacts
Turn up the heat! Young mathematicians develop models to represent different climates and collect temperature data. They analyze the data with regression and residual applications. Using that information, they make conclusions about...
National Security Agency
Equations and Expressions
Learners demonstrate their knowledge pictorially, concretely, and abstractly in this unit meant to last three hours over three days. Using hands-on activities, manipulatives, real-world applications, and problem solving, learners write...
Differentiation Central
Perimeter and Area
Leave no student behind with this differentiated geometry unit on perimeter and area. Over the course of five lessons, young mathematicians explore these foundational concepts through a series of self-selected hands-on activities and...
Polar Trec
How Much Data is Enough?
The next time you read a magazine or watch the news, make note of how many graphs you see because they are everywhere! Here, scholars collect, enter, and graph data using computers. The graphs are then analyzed to aid in discussion of...
Las Cumbres Observatory
Plotting a Supernova Light curve
Supernovas burn for a short time but can give scientists extensive information about the universe. Learners analyze given data about the change in the light magnitude of a supernova. They look for patterns in the data and use them to...
CK-12 Foundation
Two-Sided Stem-and-Lead Plots: Gamers
Which gender spends more time playing video games? Your classes use provided data to answer this question. They first build a two-sided stem-and-leaf plot and then use the display to look for patterns. Guiding questions help them...
Illustrative Mathematics
Riding by the Library
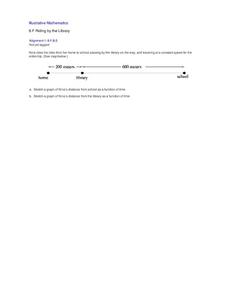
Draw a graph that shows the qualitative features of a function that has been described verbally. Make sure learners understand where time is zero and the distance is zero. It may take them some time to understand this concept, so working...
Curated OER
Time Problem Cards
In this time problem worksheet, students read story problems and determine the length of time described, or identify the time an activity should start for it to be completed at a given moment. Students must add or subtract hours and...
Curated OER
Exploring the Moon
First graders complete an experiment illustrating why the moon appears to change over time using a flashlight and ball. Students discuss the shape of the moon and identify it as a sphere. Students write a short informational piece after...
Curated OER
Rate of Change
Eleventh graders solve problems dealing with rate of change. In this algebra activity, 11th graders graph their rate of change problems and analyze it comparing their data with each other. They solve problems dealing with percent and...
Curated OER
Lesson 3: Where Does Money Come From?
Students listen to story Hundred Penny Box by Sharon Bell Mathis, explore history of money, and examine how money is produced in the United States. They discuss why money is used for exchange, and describe how money has changed over time.
National Park Service
It Was a Very Good Year
Waterton-Glacier International Peace Park includes whitebark pines that are over 1,200 years old, meaning they have been there since before medieval times. The second lesson of five details how to read tree rings for climate change and...
Space Awareness
Making A Sundial
Can people really measure time just by using the sun? Scholars venture outside on a nice, sunny day to build sundials and learn how people measured time 600 years ago. The class builds two different sundials while gaining practice with...
Curated OER
Math Club #5: Miscellaneous II
In this math club #5: miscellaneous II worksheet, 6th graders work in groups to solve 10 miscellaneous word problems using logic and problem solving skills.
Curated OER
What is a Family?
Students explore how Canadian families have evolved over time. In this census results lesson, students examine the factors that contribute to changing family and household structures. Students also create written and illustrated profiles...
Curated OER
Missouri Rice Farming
Sixth graders investigate rice farming in Missouri. In this percentages lesson, 6th graders determine how much rice production has increased over time. Students find this number in percentages. Students then figure the percent of acres...
Curated OER
A Sweet Drink
Students investigate reaction rates. In this seventh or eighth grade mathematics lesson, students collect, record, and analyze data regarding how the temperature of water affects the dissolving time of a sugar cube. Studetns determin...
Curated OER
Fractions and Mixed Numbers
This series of math presentations by Monica Yuskaitis is outstanding! This installment teaches youngsters about fractions and mixed numbers. The graphics, examples, and text throughout this presentation are engaging and should help...
Mathalicious
On Your Mark
With many factors leading to a great athlete, does height make Usain Bolt unfairly fast? Middle schoolers conduct analysis to change the running distance of the Olympic races to be proportional to the height of the participants. They...


