EngageNY
Solution Sets to Simultaneous Equations (part 1)
How are systems related? Build on your pupils' previous knowledge of solving systems of equations by introducing systems of inequalities. Learners explore similarities between systems of equations and inequalities to make a strong...
Virginia Department of Education
May I Have Fries with That?
Not all pie graphs are about pies. The class conducts a survey on favorite fast food categories in a lesson on data representation. Pupils use the results to create a circle graph.
Curated OER
Rates Of Change
Students investigate the rate of change and how it effects a function over a given interval. They examine the slope of a line that is seccant and how it is compared to a tangent line and then determine the changes of a function at any...
Curated OER
Transformations
Pupils identify the types of transformations in their lives. As a class, they determine the ones they have control over and which ones they do not. They practice solving problems in math and oral communication that they are faced with on...
Curated OER
Transportation Through Time
Third graders measure the speed at which they can walk in order to understand speed and distance traveled. They then research the history of transportation and express data in a class timeline.
Curated OER
Cool Times with Heat
Students work with thermometers to complete problems about temperature. They investigate cooling patterns, how location affects temperature, and what happens when water having different temperature is mixed. They measure temperature in...
Curated OER
SPENDING: Maintaining the Skill of Money
Fourth graders explore the concept of maintaining money. In this personal finance lesson, 4th graders earn "money" for cleaning their classroom desks. Students spend the "money" in the classroom and practice making change.
Curated OER
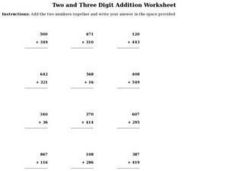
Two and Three Digit Addition Worksheet
For this addition with carrying worksheet, students solve 12 problems in which 2 and 3 digit numbers are added. There is carrying on the page.
Curated OER
How Fast Is Your Car?
Eighth graders discover the relationship between speed, distance, and time. They calculate speed and represent their data graphically. They, in groups, design a ramp for their matchbox car. The goal is to see who's ramp produces the...
Curated OER
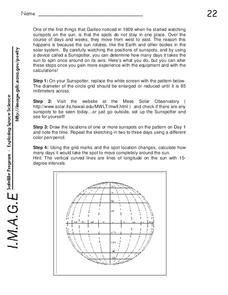
Sunspots and the Sun's Rotation
In this sun worksheet, students use a Sunspotter to observe the rotation of the sun by identifying the presence of sunspots and watching them rotate over time. Students calculate how many days it takes to see the sunspots they observe in...
Curated OER
Agriculture Counts
Students discuss the kinds of things they count and how to use tally marks. In this social science activity, students count animal crackers by using tally marks for each kind of animal. The tally marks are changed into numbers and one...
Curated OER
The Good, The Bad, The Ugly
Sixth graders examine the causes of the stock market crash of 1929. In this integrated math/history unit on the stock market, 6th graders study, research, and read stocks, visit a local bank, and create a PowerPoint to show the finished...
Curated OER
Math: Collecting and Analyzing Date
Children count how many of an activity they can do in a row, such as ball tossing and record the date and count. Children track over a period of time and graph results.
Curated OER
Correlation of Variables by Graphing
Middle and high schoolers use a spreadsheet to graph data. In this graphing instructional activity, learners determine how two parameters are correlated. They create a scatter plot graph using a computer spreadsheet.
Curated OER
Speed and Acceleration
In this speed and acceleration worksheet, students complete math word problems having to do with speed and acceleration. Students complete 13 problems.
Curated OER
Float the Boat
Students collect data and analyze it using a graph. In this algebra lesson plan, students identify different bodies of water and relate the flowing to math. They collect data on the rate of flow and the height of flow. They analyze the...
Virginia Department of Education
Functions 2
Demonstrate linear and quadratic functions through contextual modeling. Young mathematicians explore both types of functions by analyzing their key features. They then relate these key features to the contextual relationship the function...
Space Awareness
How To Travel On Earth Without Getting Lost
Have you ever wanted to travel the world? Take a virtual trip with a geography lesson plan that uses longitude and latitude, the position of the sun, an astronomy app, and a classroom globe.
Curated OER
Lego Robotics: Measuring Speed
Students build and program a LEGO robotic car as well as measure and graph its speed. They acquire familiarity with principles of construction, motion, design and problem solving. They compare a robot's speed over two different surfaces...
Curated OER
Home Sales Records
Teach your class how to calculate monthly payments on a home mortgage. In this percent lesson, young scholars calculate the monthly payment on a home mortgage, and compare different lengths of time and the interest rates for national...
Curated OER
A Shadow of Yourself
Learners measure the length of their shadows three times during the day, Students determine the differences in shadow lengths after each measurement. They discuss why the length changed from one time of day to another.
Curated OER
Observing Weather
Students investigate the weather by reading children stories. In this weather observation lesson, students read Cloudy With a Chance of Meatballs and several other stories about weather before they create a KWL chart. Students utilize...
Curated OER
Shedding Light on the Weather with Relative Humidity
Learners study weather using a graphing calculator in this lesson. They collect data for temperature and relative humidity for every hour over a day from the newspaper, then place the data in their handheld calculator and examine it for...
Curated OER
Take Another Look
Seventh graders analyze different types of graphs and answer questions related to each. In this math lesson, 7th graders organize a given diagram to make it easier to interpret. They discuss why they made such changes.


