Curated OER
Then and Now
Students conduct research and use census data to compare different times and places. In this census instructional activity, students interpret data from charts and graphs, comparing census information from two time periods as well as...
Curated OER
Data Analysis and Probability
Students make their own puzzle grid that illustrates the number of sit-ups students in a gym class did in one minute, then they make a histogram for this same data. Then they title their graph and label the scales and axes and graph the...
Curated OER
Deer: Predation or Starvation
In this predation or starvation worksheet, students read about the effects of the wildlife service bringing in predators (wolves) to control a deer population. Students calculate the change in the deer population from 1971 to 1980. They...
Curated OER
Line Graphs
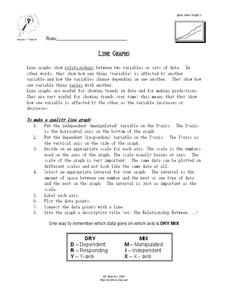
In this algebra worksheet, students describe the relationship between a line graph and its data. They define the reasons line graphs are used and discuss increasing and decreasing lines. There is one involved questions, requiring several...
Curated OER
Which Amusement Park Would You Choose?
Students analyze data related to amusement parks and create a spreadsheet to display the data. They read the data and predict which amusement park they think is safer, create a spreadsheet and graph, and write a proposal based on their...
Curated OER
Peanut Butter Broccoli - Creating New Produce Through Genetic Selection
Fifth graders understand that traits are inherited and change over time. In this physical traits lesson, 5th graders compare produce items for similar traits. Students create large graphs to show their results. Students discuss genetic...
Curated OER
Worksheet 27 - Spring 1996
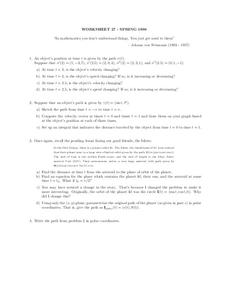
In this math instructional activity, students examine the position of an object and then use the formulas to determine its path over time. Then they apply the information in order to determine the traveling path of an asteroid in space.
Curated OER
Mapping Ancient Coastlines
Most of this lesson is spent working on the "Bathymetry Worksheet." It includes a graph of the changes in sea level over the past 150,000 years and a bathymetric map of changes in an imaginary coastline over time. Participants answer...
Curated OER
A History of Changing Foods
Students conduct Internet research to determine how food preparation and recipes have changed over time. They trace a favorite food through time, complete a worksheet and compare diets from different eras.
Curated OER
Prime Time Math: Emergency
Eighth graders, while using Prime Time Math: Emergency software, use math and medical data to participate in the diagnosis of a girl. Just like the medical team in the story, they will be using math to respond to a medical emergency- a...
Curated OER
Recession Lesson: The Silver Lining of the Economic Downturn
Students discuss money and interest. In this discussing money and interest lesson, students discuss positives of an economic recession. Students discuss how savings rates have increased over time and the general attitude towards...
Curated OER
How Does Temperature Vary Over Time?
Students examine the temperature flucuations on the Earth. After defining new vocabulary, they identify the flucuations of the Earth on a map. As a class, they develop a hypotheis on the temperature variation by examining the data.
Curated OER
Affine Recurrence Plotter
Learners use the on-line affine recurrence plotter to graph equations. They work on-line to create graphs of trout in a trout pond and savings account balances when interest is compounded over time. Links to the four one-day lessons are...
National Wildlife Federation
Wherefore Art Thou, Albedo?
In the sixth lesson in a series of 21, scholars use NASA data to graph and interpret albedo seasonally and over the course of multiple years. This allows learners to compare albedo trends to changes in sea ice with connections to the...
Curated OER
Women's Wartime Roles
Students explore the role of women during times of war. They examine the various roles that women have played in wars throughout United States history and how they have changed over time. In addition, they role-play presentations as if...
Curated OER
Worksheet 20
In this math learning exercise, students Investigate the structure and function of how the numbers of people infected with HIV changes over time. They answer the fact of it either increasing or decreasing.
Curated OER
Religious Book Sales Climb
In this analyzing data worksheet, students review a graph from the USA Today. Students study the graph and answer four questions about the graph. There are also two extension questions included.
Curated OER
Fizzy Pop
Fifth graders compare and identify variables that affect the rate of a chemical change using Alka-Seltzer, water, ice, and hot water. They time how long each variable takes to pop the canister into the air, and record the results on a...
Curated OER
Take Another Look
Seventh graders analyze different types of graphs and answer questions related to each. In this math lesson, 7th graders organize a given diagram to make it easier to interpret. They discuss why they made such changes.
Curated OER
The Hudson's Ups and Downs
Fifth graders practice interpreting line graphs of the Hudson River water levels to assess the tides and tidal cycles in the estuary. They explore how weather can affect water levels and tides and observe that high tides and low tides...
Curated OER
Timed Multiplication Test Graphs
Students use the tools of data analysis for managing information. They solve problems by generating, collecting, organizing, displaying histograms on bar graphs, circle graphs, line graphs, pictographs and charts. Students determine...
NOAA
Climate, Weather…What’s the Difference?: Make an Electronic Temperature Sensor
What's the best way to record temperature over a long period of time? Scholars learn about collection of weather and temperature data by building thermistors in the fourth installment of the 10-part Discover Your Changing World series....
Curated OER
Comparing Graphs of Temperature and Radiation
Students study plots and use a Live Access Server to generate plots. In this temperature lesson students examine the process of incoming and outgoing radiation.
Curated OER
Rate of Change
Eleventh graders solve problems dealing with rate of change. In this algebra activity, 11th graders graph their rate of change problems and analyze it comparing their data with each other. They solve problems dealing with percent and...


