Curated OER
Traveling Through Time, Wetland Style
Students create a timeline on the development of the Pajaro Valley Area. In this social science lesson, students discuss the changes that took place in the area over the past 300 years. They draw a pictures of how the area has changed...
Curated OER
How Does Speed Change?
In this speed instructional activity, students use a graph that shows various speeds to answer 13 questions. For example. "What is the greatest speed the worm reaches?"
Curated OER
Graphing Weather
Young scholars make a graph. In this weather lesson, students fill in a KWL chart about different types of weather. Young scholars watch a PowerPoint presentation about weather and natural disasters and where these types of weather are...
Illustrative Mathematics
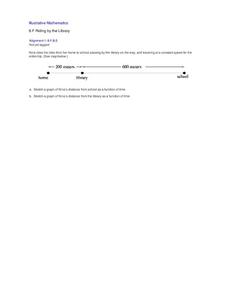
Riding by the Library
Draw a graph that shows the qualitative features of a function that has been described verbally. Make sure learners understand where time is zero and the distance is zero. It may take them some time to understand this concept, so working...
Physics Classroom
A Wiggle in Time Lab
Though an alternative method is suggested, the best way to carry out this investigation is with the use of a computer-interfaced motion detector. Physics fanatics hang a mass on the end of a spring and analyze its motion verbally,...
Curated OER
Voltage Vantage
Learners measure the voltage discharge of robots as the motors are used. In this physics lesson, students explain how to use a multimeter to measure voltage. They graph the voltage change over time and present their findings in class.
Curated OER
What is a Family?
Students explore how Canadian families have evolved over time. In this census results lesson, students examine the factors that contribute to changing family and household structures. Students also create written and illustrated profiles...
Federal Reserve Bank
FRED in the Classroom: Measures of Inflation
Don't just tell class members about how to measure inflation, have them experience it firsthand by asking them to work with real data and construct graphs!
National Park Service
What Can We Do?
Motivate young conservationists to stand up and make a change. After learning about the efforts in Cascade Nation Park to reduce carbon emissions in order to preserve the wilderness, students work in groups creating action plans for...
Creative Learning Exchange
The Infection Game: The Shape of Change
Encourage the spread of knowledge in your class with this cross-curricular epidemic simulation. Pulling together science, social studies, and math, this activity engages learners in modeling the spread of infectious diseases, collecting...
Space Awareness
The Thermal Layers of Oceans
How much does the sun heat up a lake or ocean? Scholars use a cup and a strong lamp to investigate the heat transfer and thermal layers in the ocean to come up with the answer. They collect data and graph it in order to better understand...
Curated OER
Let's Line Them Up! Post Test
In this line graphs worksheet, students answer multiple choice questions about line graphs. Students complete 10 multiple choice questions.
Curated OER
Bias in Statistics
Students work to develop surveys and collect data. They display the data using circle graphs, histograms, box and whisker plots, and scatter plots. Students use multimedia tools to develop a visual presentation to display their data.
Pennsylvania Department of Education
Adding and Subtracting Three-Digit Numbers by Jumping
Second graders use data to graph information and draw conclusions. In this lesson on data analysis, 2nd graders practice gathering, sorting, comparing, and graphing data. Students differentiate data that can and cannot change over time.
Curated OER
Beach Profiling
Students explore waves, winds and their effect upon the shape of the beach. They participate in hands-on observations and take measurements along the beach to create a profile of its appearance. Students record their observations, create...
Curated OER
Call of The Wild
Prompt your class to interact with Jack London's Call of the Wild. By analyzing the events in the novel, middle schoolers discover how human experiences create who a person becomes. They critique and analyze the reading, focusing on...
Curated OER
Magnetic Storms
In this magnetic storms worksheet, students use a graph of data collected over time showing the magnitude of a magnetic storm. Students use the data to solve 6 problems about the graph and they determine the strength of the storm at...
Curated OER
Population and Productivity: Two P's in a Pod
Students investigate the link between countries' population growth rates and levels of industrialization. They observe that, over time, as a country becomes more industrialized, its population growth rate decreases.
Curated OER
What Did It Cost 100 Years Ago?
Students compare prices of good across the century in order to introduce the topic of inflation. They undertand the concepts of inflation and Consumer Price Index (CPI), use online calculators to figure the approximate cost of goods...
Curated OER
Let's Graph It
In this let's graph it worksheet, student interactively answer 10 multiple choice questions about graphing data and types of graphs, then click to check their answers.
Curated OER
Cool Times with Heat
Students work with thermometers to complete problems about temperature. They investigate cooling patterns, how location affects temperature, and what happens when water having different temperature is mixed. They measure temperature in...
Beyond Benign
Water Bottle Unit
How much plastic do manufacturers use to create water bottles each year? The class explores the number of water bottles used throughout the years to determine how many consumers will use in the future. Class members compare different...
Curated OER
Forest Activity: Interpreting a Graph
Young scholars research forest growth online. They analyze the parts and contents of a graph, then summarize in narrative form the changes in the forest over time.
Curated OER
The Greenhouse Effect in a Jar
Students explore climate change by participating in a physical science experiment. In this greenhouse effect lesson, students discuss the impact global warming has on our environment and how it works. Students utilize a glass jar,...


