Curated OER
Sailin' Through Time...Rhode Island, The Ocean State
Fourth graders explore the history of Rhode Island. They research famous people who brought change to the state. They explore the state song, natural resources, and colonies of the state. In groups, 4th graders create a travel brochure...
Curated OER
The Lake Effect
Fourth graders conduct an experiment demonstrating the effects of water and air temperature on precipitation. They create graphs demonstrating their findings using Claris Works for Kids.
Curated OER
Time Changes Everything
Students analyze census data from 1915, 1967 and 2006. They read an article about how the world's population is growing at an alarming rate. They use primary source documents to create a timeline on the information they gathered. They...
Curated OER
Line 'Em Up!
Students find coordinate points on a grid and create a line graph with those points. This lesson should ideally be used during a unit on various types of graphs. They make and use coordinate systems to specify locations and to describe...
Curated OER
Heating/Cooling Curve
For this heating and cooling curve worksheet, learners use a given graph of a substance being heated from a solid to a liquid and then a gas over time. They use the graph to answer eleven questions about the phases of the substance and...
Curated OER
Banking on a Good Turn
Young scholars research the economies of countries in the Group of 8 and present how their economies have changed over the past five years and how the relationships among these countries affect each other in light of world events.
Curated OER
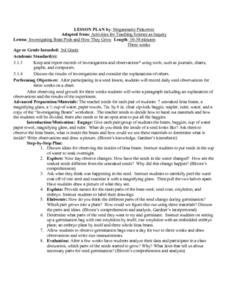
Investigating Bean Pods and How They Grow
Third graders observe and create a record of seed growth over time. After planting a seed, 3rd graders record their observations of the seed's growth over a three week period. Upon conclusion of the experiment, they write a paragraph...
Curated OER
Predator-Prey Simulation
Students simulate a predator-prey interaction in an ecosystem. Students use different size squares cut from paper to represent predators and prey. They simulate the interactions of the species by following instructions for the capture of...
Curated OER
Native Species Restoration and its Impact on Local Populations
In this native species restoration worksheet, students are given 3 scenarios to choose from to help restore a declining population of an endangered species of deer. Students make predictions about what they will think happen when the...
Curated OER
Gaia: The Wisdom of the Earth
Learners are introduced to Gaia theory of natural homeostasis. They graph Earth's temperatures over time, construct terrariums or monitor the outdoor environment. Related videos titles are suggested, but may be outdated. The objectives...
Curated OER
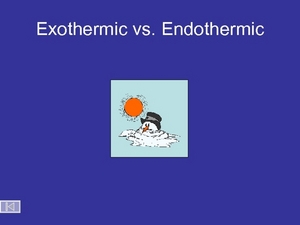
Exothermic vs. Endothermic
The PowerPoint opens with video footage of the decomposition of nitrogen triiodide and then explains it with diagrams. Graphs of exothermic and endothermic reactions are exhibited, as well as one for the effect of a catalyst on reaction...
Curated OER
Get a Leg Up
Traveling through space is an amazing experience, but it definitely takes a toll on the body. After reading an article and watching a brief video, learners perform an experiment that simulates the effects of zero gravity on the human body.
Curated OER
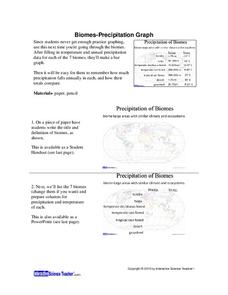
Biomes: Precipitation Graph
Students practice graphing by studying biomes. In this precipitation lesson, students graph the precipitation patterns for the 7 biomes on Earth. Students view a PowerPoint presentation in class which explores the 7 biomes and the...
Curated OER
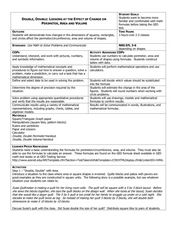
Double, Double: Looking at the Effect of Change on Perimeter, Area and Volume
Students explore perimeter, volume, and area. In this math lesson, students explore how changes in dimensions of geometric shapes affect the perimeter, area and volume of the various shapes. Students investigate the results when the...
Curated OER
Immigration Push and Pull Factors
Eighth graders examine significant ideas, beliefs, and themes; organize patterns and events; and analyze how individuals and societies have changed over time in Maryland, the United States, and the world.
Curated OER
Survivor
Seventh graders investigate changes in the ecosystem within the school year. They see that ecosystems, communities, populations, and organisms are dynamic and change over time. They, in groups, collect data in quadrants in the fall,...
Science 4 Inquiry
The Ups and Downs of Populations
Life has its ups and downs ... especially if you're an animal! Biology scholars engage in a population study through an inquiry-based lesson. Pupils work together to explore the factors that affect deer populations, then examine the...
Curated OER
The Appliance Explosion
Students explain why the number of appliances used today differs greatly from the number used previously. They construct a bar graph to show changes in appliance use over a period of time. They also list appliances that could be eliminated.
K12 Reader
Displaying Data
It's important to learn how to display data to make the information easier for people to understand. A reading activity prompts kids to use context clues to answer five comprehension questions after reading several paragraphs about...
EngageNY
Constant Rates Revisited
Find the faster rate. The resource tasks the class to compare proportional relationships represented in different ways. Pupils find the slope of the proportional relationships to determine the constant rates. They then analyze the rates...
Curated OER
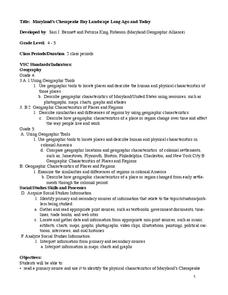
Maryland’s Chesapeake Bay Landscape Long Ago and Today
Combine a fantastic review of primary source analysis with a study of Captain John Smith's influence on the Chesapeake Bay region in the seventeenth century. Your young historians will use images, a primary source excerpt, and maps...
Curated OER
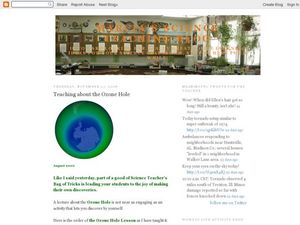
Teaching About the Ozone Hole
A PowerPoint and an accompanying worksheet introduce young meteorologists to the hole in the ozone layer. Another handout provides a coloring and graphing activity which examines the changes in the ozone. There are also links to neat...
Science Matters
Spaghetti Fault Model
Does increasing the pressure between two moving plates provide a stabilizing force or create more destruction? The hands-on lesson encourages exploration of strike-split fault models. The sixth lesson in a 20-part series asks scholars to...
Curated OER
Tides in the Hudson
Young scholars view an illustration of the Hudson River watershed and identify the bodies of water shown. They discuss what happens when fresh and salt water mix. Students view a teacher demonstration of the stratification of fresh and...


