Curated OER
Calculating The Poverty Line
Students examine the poverty line. In this poverty line lesson, students discover what the poverty line is and how the U.S. government determines it. Students calculate alternative poverty lines and examine their implications.
College Board
Calculus at the Battle of Trafalgar
All's fair in math and war. Scholars examine the Battle of Trafalgar using calculus. They set up and solve a system of differential equations to determine the number of ships remaining in each fleet over time.
Curated OER
How Do Plants Grow?
Students investigate plant growth. In this plant growth lesson, students investigate what would happen to plants if they did not have water and sunlight. Students conduct experiments to determine what plants need. Students create a...
Curated OER
Earth's Warming Climate: Are We Responsible
Students examine the atmospheric data for CO2. In this web-based atmospheric lesson plan, student follow instructions to examine and plot on-line scientific data about the CO2 levels in our atmosphere and analyze the changes found in the...
Curated OER
Mapping Ancient Coastlines
Most of this instructional activity is spent working on the "Bathymetry Worksheet." It includes a graph of the changes in sea level over the past 150,000 years and a bathymetric map of changes in an imaginary coastline over time....
Curated OER
Line 'Em Up!
Students find coordinate points on a grid and create a line graph with those points. This lesson should ideally be used during a unit on various types of graphs. They make and use coordinate systems to specify locations and to describe...
Curated OER
Walking on Thin Ice
Students examine scientific evidence of changes in the Arctic ice cover. They participate in a simulation of an international conference and debate the relationship between global warming and changes in the arctic ice cover.
Curated OER
The Geography of the United States
Full of bright maps and interesting information, this presentation details U.S. Geography. Slides include basic facts about size, regions, topography, and demographics, as well as fascinating trivia about the United States, including...
Curated OER
Affine Recurrence Plotter
Learners use the on-line affine recurrence plotter to graph equations. They work on-line to create graphs of trout in a trout pond and savings account balances when interest is compounded over time. Links to the four one-day lessons are...
Curated OER
Women's Wartime Roles
Learners explore the role of women during times of war. They examine the various roles that women have played in wars throughout United States history and how they have changed over time. In addition, they role-play presentations as if...
Curated OER
It's About Time
Students create their own timeline. In this social science lesson, students write the important events that happened in their lives on their timeline and then compare their timeline to Earth's timeline.
Curated OER
Line Graphs
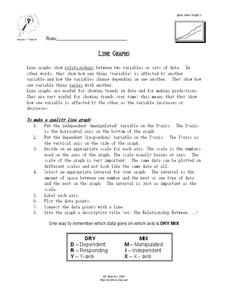
In this algebra worksheet, students describe the relationship between a line graph and its data. They define the reasons line graphs are used and discuss increasing and decreasing lines. There is one involved questions, requiring several...
Curated OER
Graphing Sea Ice Extent in the Arctic and Antarctic
Students graph sea ice data and predict long term trends in the data. In this climate change lesson, students use sea ice data from the Arctic and Antarctic to construct line graphs. They use their graphs to predict the effects of global...
Curated OER
Interpreting Data and Statistics using Graphs
Seventh graders interpret data. In this lesson on types of graphs, 7th graders construct, interpret, and analyze different graphs. This lesson includes worksheets and resources.
Curated OER
Ecosystem Interdependence
Young scholars outline a scenario demonstrating ecosystem interdependence. They explain the effects of this change according to the food web. They give a positive example such as increased rain and have the students call out answers to...
Curated OER
The Effects of "Recreational" Drugs on the Development of Chick Embryos as a Model for Human Embryogenesis
Students conduct experiments on fertilized chicken embryos to determine the possible developmental effects that various recreational drugs (caffeine, alcohol, nicotine, and aspirin) might have on them.
Willow Tree
Bar Graphs
Circles, lines, dots, boxes: graphs come in all shapes in sizes. Scholars learn how to make a bar graph using univariate data. They also analyze data using those bar graphs.
Wild BC
Weather Where We Live
Over a span of two weeks or more, mini meteorologists record weather-related measurements. What makes this particular resource different from others covering similar activities are the thorough details for the teacher and printables for...
University of Texas
Lives of Stars
Stars exist from a few million years to over 10 billion years, depending on their mass. Scholars perform a play acting as stars to learn about their different life cycles. They develop an understanding of many of the fundamental concepts...
Curated OER
Straight Line Motion in Two Parts
Students describe and quantify the motion of toy cars. In this motion instructional activity, students observe a battery powered toy car on a flat surface and a standard toy car on a sloped surface. They write their observations, measure...
Illustrative Mathematics
Riding by the Library
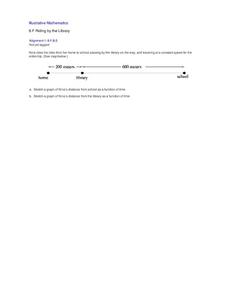
Draw a graph that shows the qualitative features of a function that has been described verbally. Make sure learners understand where time is zero and the distance is zero. It may take them some time to understand this concept, so working...
NASA
Solar Storms
In this solar storms worksheet, students use an on line source to read newspaper stories about scientific theories and hypothesis related to space weather phenomena. Students answer 7 questions about past solar storms and compare ideas...
Khan Academy
Challenge: A Loopy Landscape
Drawing trees and grass over and over again is the perfect time to add a while loop to your computer code. This activity guides coders through the steps as they practice using this loop.
Curated OER
Graph Made Easy: Post Test
In this graphs worksheet, learners answer multiple choice questions about line graphs and bar graphs. Students answer 10 questions total.


