WK Kellogg Biological Station
Plotting Phenology
Finally, a worksheet that involves more than filling in some blanks. Your budding ecologists must graph and analyze three sets of data, then synthesize the information as they think about the impacts of plant reproduction on insects and...
Curated OER
Westward Expansion
Students locate California and New York on a map and explore available means of travel in the 19th century. Students explore the role of trade in pioneer America and simulate various barter transactions.
Curated OER
Choosing the Best Graph
For this mathematics worksheet, 6th graders use a line graph to illustrate how a measure of data changes and explain their reasoning. Then they use a bar graph to compare pieces of data and a pictograph to compare data.
Curated OER
The Origins and Maintenance of Earth's Atmosphere
In this atmosphere worksheet, students read over a data table showing the percentage of carbon dioxide, oxygen and nitrogen in the atmosphere over the last 4500 million years. Students create a graph comparing these gases over time and...
Curated OER
American Inventors
In this inventors on-line worksheet, students read short passages about the nineteenth century American inventors Thomas Edison, Benjamin Franklin, and Alexander Graham Bell. They answer 5 fill in the blank and answer 5 multiple choice...
Curated OER
Human Populations Studies: the Ghost of Populations Past
High schoolers compile data on population distribution and develop survivorship curves using information from cemetery tombstones and obituaries. They develop inferences on the changes in population age distribution in their area over time.
Curated OER
Timed Multiplication Test Graphs
Students use the tools of data analysis for managing information. They solve problems by generating, collecting, organizing, displaying histograms on bar graphs, circle graphs, line graphs, pictographs and charts. Students determine...
Nikola Tesla documentary student worksheet
PBS documentary: Tesla - Master of Lightning; this worksheet will keep the students engaged while watching this excellent documentary about Tesla. The documentary can be found on Netflix or YouTube. It will take two class periods to...
Curated OER
Exponential Reflections
High Schoolers explore the concept of exponential reflections. They use their Ti-Nspire to reflect the natural logarithm function over the line y=x. High schoolers repeat the process using different exponential functions using a slider.
Curated OER
Mapping Mount St. Helens
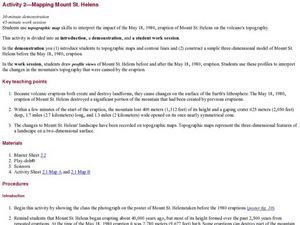
Students study topographic maps and contour lines and construct a simple three-dimensional model of Mount St. Helens before the May 18, 1980, eruption. They use topographic map skills to interpret the impact of the May 18, 1980, eruption...
Curated OER
States of Matter Lesson
Second graders identify the three phases of matter and demonstrate how a property can change states of matter. In this states of matter lesson, 2nd graders make an Ooze to discover how a solid changes into a liquid. Students...
Curated OER
Solar/Lunar Eclipses and the Seasons
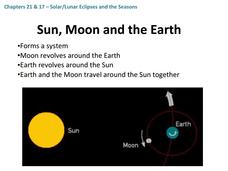
How do the moon, sun, and Earth line up to create eclipses? Why do the seasons change throughout a year? The answers to these questions are explained through this series of slides. This apt presentation outlines information using bullet...
NCAA
NCAA Volleyball Scoresheet
Volleyball coaches can utilize this standard scoresheet template to track games and team progress over the course of the season. The resource allows for recording serving and rotation order, points scored, substitutions, sanctions, and...
Curated OER
Lesson 2 Activity 2: Mapping Mount St. Helens
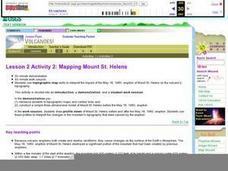
Learners use topographic map skills to interpret impact of the May 18, 1980 eruption of Mount St. Helens on the volcano's topography, and draw profile views of Mount St. Helens before and after the May 18, 1980, eruption.
Curated OER
Student Handout 6E: Trail of the Tomato Group E: Farm Workers
What is life like for migrant farm workers picking tomatoes at the industrial level? Your class will research and create a visual display describing farm life, work on the farm, and the pressures put on agricultural producers by high...
Curated OER
Graph Your Motion
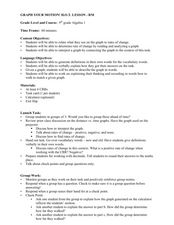
Students graph their linear equations. In this algebra lesson, students examine their lines and relate it to the slope or rate of change. They relate the steepness of the line to the slope being positive, negative or zero.
Curated OER
Global Warming: Introduction to Global Warming
Students gather information about global warming and climate changes in preparation for future lessons on the Greenhouse Effect.
Curated OER
Change the World, One Month at a Time
Learners complete monthly acts of kindness using the given instructions. In this acts of kindness lesson plan, students follow the directions for each month to create and give an act of kindness to their classmates or other individual.
Curated OER
Rates Of Change
Students investigate the rate of change and how it effects a function over a given interval. They examine the slope of a line that is seccant and how it is compared to a tangent line and then determine the changes of a function at any...
Curated OER
How are Things Lining Up
In this consumer math worksheet, students use the web to research and select a stock to buy. Students track and graph the stock’s activity over a two week period. The one page worksheet contains a blank graph and four...
Curated OER
Hare and Lynx Population
Fourth graders study changes in animal population. In this graphing lesson, 4th graders create graphs from information read to them about hares and lynx populations. They will describe patterns of change in the graphs and discuss why...
Curated OER
Freedom Summer
Students brainstorm and discuss what the concept of "fairness" is and how to identify examples of "fairness." They pull from historical fiction and the Civil Rights Movement to explain how individual are affected by, cope with, and...
Curated OER
Data Analysis and Probability
Learners make their own puzzle grid that illustrates the number of sit-ups students in a gym class did in one minute, then they make a histogram for this same data. Then they title their graph and label the scales and axes and graph the...
Curated OER
Historical Perspective And Heroes: the Battle At Little Bighorn
Eleventh graders explore the phenomenon of historical perspective. They examine different accounts of the Battle of the Little Bighorn and how the views differed not only along cultural lines but also with the passage of time.


