Curated OER
Getting Started with the TI-Navigator™ System: What's My Line?
Learners analyze linear functions in this algebra instructional activity. They explore the meaning of slope and the slope-intercept form of a line as they investigate the effect changing parameters on the graph of a linear function.
Illustrative Mathematics
Baseball Cards
Here is a resource that demonstrates growth and the initial state of an equation. In this case, your class will be looking at baseball collections. How many baseball cards did the collector start out with, and how many were added or...
Anchorage School District
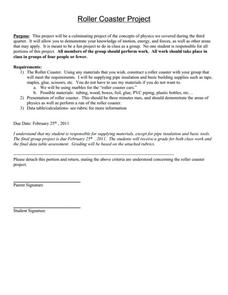
Roller Coaster Project
Emerging engineers work in teams to design pipe insulation roller coasters for marbles that meet specific parameters. They are required to label along the track the areas where kinetic and potential energy are highest and lowest, where...
Curated OER
Correlation of Variables by Graphing
Middle and high schoolers use a spreadsheet to graph data. In this graphing lesson plan, learners determine how two parameters are correlated. They create a scatter plot graph using a computer spreadsheet.
American Chemical Society
Controlling the Amount of Products in a Chemical Reaction
Everyone enjoys combining baking soda and water. Here is a lesson that challenges scholars to analyze the reaction three different ways — the real substances, the chemical equation, and the molecular models. Class members experiment to...
Curated OER
Design of Airfoil for Given Lift
Students use FoilSim to design an airplane wing that generates a given lift. As they change parameters such as airspeed, altitude, angle of attack, thickness and curvature of the airfoil, and size of the wing area, the software...
Curated OER
Getting it Right!
Students investigate error. As shown in earlier activities from navigation lessons 1 through 3, without an understanding of how errors can affect position, one cannot navigate well. Students explore how computers can help in navigation....
Curated OER
Graph Dynamic Linear Equations
Students explore the concept of linear equations. In this linear equation lesson, students change parameters of an equation and notice the effect it has on its graph.
Curated OER
Sinusoidal modelling of Canad'a youth cohorts
Students explore the general form of the sine equation. In this trigonometry instructional activity, students explore the relationship between the changing parameters and the graph of the sine equation. Students use data and a...
Curated OER
Is Grandpa Right, Were Winters Colder When He Was a Boy?
Students compare current weather data to historic data to see if there is a temperature change. For this weather lesson students complete a lab activity and determine average changes in temperature, precipitation and cloud cover.
US Navy
The Science of Diving
Introduce gas laws using the popular topic of SCUBA diving. This activity makes a connection between the gas laws and the effect of pressure and temperature changes during diving. Young engineers complete introductory experiments to...
Curated OER
Exploring Quadratic Data with Transformation Graphing
Using a data collection device to collect data regarding a bouncing ball, students use various features on graphing calculators to experiment with the parameters of the vertex form of the parabola and their effect on the shape of the...
Curated OER
Worksheet 28: Parametric Equations
In this parametric equations worksheet, young scholars read informational paragraphs and answer 10 questions regarding parameter, velocity, speed, curvature, parametric equations, and scalar curvature.
EngageNY
Rotations
Searching for a detailed lesson to assist in describing rotations while keeping the class attentive? Individuals manipulate rotations in this application-based lesson depending on each parameter. They construct models depending on the...
Colorado State University
If You Can't Predict the Weather, How Can You Predict the Climate?
Why is the weather man wrong so often? Young climatologists discover how chaos rules both weather and climate through a math-based activity. Using an iterative equation, the class examines how small day-to-day weather events total up to...
Teach Engineering
Computer Simulation of the Sonoran Desert Community
See how changes in initial populations and parameters affect a biological community. Individuals use a special software program to simulate a desert community with five species. They adjust initial populations to see how the community...
Shodor Education Foundation
Plop It!
Build upon and stack up data to get the complete picture. Using the applet, pupils build bar graphs. As the bar graph builds, the interactive graphically displays the mean, median, and mode. Learners finish by exploring the changes in...
Curated OER
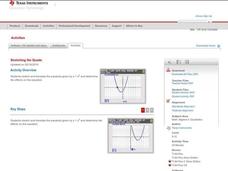
Stretching the Quads
Explore parabolas in this algebra lesson with the graphing calculator. The class investigates what effects the changing of the parameters of the vertex form of a quadrati have to its graph. They find the zeros of a quadratic graphically...
Teach Engineering
Ice, Ice, PV!
Knowing the temperature coefficient allows for the calculation of voltage output at any temperature. Groups conduct an experiment to determine the effects of temperature on the power output of a solar panel. The teams alter the...
Shodor Education Foundation
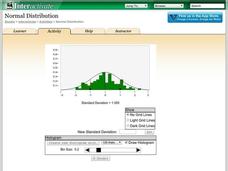
Normal Distribution
Does the size of the bin matter? The resource allows pupils to explore the relationship between the normal curve and histograms. Learners view histograms compared to a normal curve with a set standard deviation. Using the interactive,...
Curated OER
Affine Recurrence Plotter
Learners use the on-line affine recurrence plotter to graph equations. They work on-line to create graphs of trout in a trout pond and savings account balances when interest is compounded over time. Links to the four one-day lessons are...
Firelands Local Schools
Exponential Growth and Decay
How can you safely model exponential growth and decay? A hands-on activity uses candies to model not only exponential decay, but also exponential growth. Exponential equations are fitted by hand and by use of a calculator to the data...
Curated OER
Outcomes Science 4: Earth & Beyond
In this earth and beyond science worksheet, students read through 11 pages of information on weather, global warming, climate change and other related topics. There are many website links on the pages that provide additional information...
Curated OER
Families of Functions
Students investigate families of functions. In this families of functions lesson, students discuss how changing a functions parameters affect its' graph. Students vary slope and y-intercepts of linear functions. Students stretch and...


