Curated OER
Monster Graph Activity
Seventh graders engage in a instructional activity which take the fear out of graphing. They create and draw conclusions from data found in a Monster graph.
Curated OER
Let's Graph It!
Students graph the height of others in centimeters and inches, find the slope of line in order to calculate the conversion factor between centimeters and inches.
Curated OER
Data Analysis Digital Display
Students create a survey online. In this math lesson, students graph survey data using flisti.com. They share and analyze their classmates' histogram.
Curated OER
Positive Future Fair Project
Ninth graders view the film "Pay It Forward" and discuss what kind of public campaign is needed to move people to positive action. They consider different ways of presenting information (graphs, visual displays, etc.) as tools for...
Curated OER
Our Favorites
Students participate in and conduct a survey to determine various class favorites. They collect, organize and display their data, interpret the results, and complete a packet of worksheets to display the information.
Curated OER
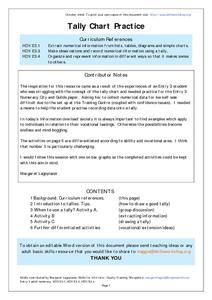
Tally Chart Practice
In this tally chart activity, students will read about tally charts and their uses. Students will make a list of when and why they could make a tally chart. Next students will complete a tally chart and write statements about the...
Curated OER
Obstacles to Success: Misleading Data
Eleventh graders explore how data reported by country agencies can mislead the public intentionally or unintentionally. In this Cross Curricular activity, 11th graders analyze charts and graphs in order to draw conclusions. Students...
Curated OER
Let's Plot Points
Use coordinate grid paper to plot points and identify shapes that are already plotted on the paper by saying their coordinates. Pupils also measure the distance between points and play the game Battleship. There are several web links and...
Curated OER
Virtual Field Trip
This hands-on resource has future trip planners analyze graphs of mileage, gasoline costs, and travel time on different routes. While this was originally designed for a problem-solving exercise using a Michigan map, it could be used as a...
Curated OER
Ready for Roots
Fourth graders sort seeds and predict what conditions are needed for them to germinate. They keep the seeds moist, observe and measure their growth and graph the results. As the seeds start to grow students compare and contrast the each...
Curated OER
Exploring Exponential Growth and Decay Functions
Pupils differentiate between exponential growth and decay. In this algebra lesson, students solve exponential equations using properties of exponents. They use the Ti calculator to graph and analyze their functions.
Curated OER
WHAT IS THE POPULAR COLOR?
Fourth graders graph cars according to their colors. They complete the graph including a title, scale, x-axis, and y-axis. Students collect the data and choose the type of graph to be made.
Curated OER
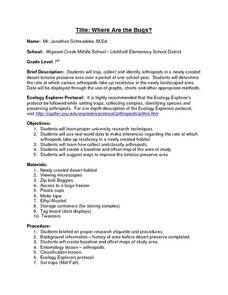
Where Are the Bugs?
Students trap, collect and identify arthropods in a newly created desert tortoise preserve area over a period of one school year. They determine the rate at which various arthropods take up residence in the newly landscaped area. Data is...
Curated OER
Old Glory
Learners utilize mathematical concepts such as: measurement, ratio and proportion and geometric probability to analyze the components of the U.S. Flag. They collect, organize and interpret data by constructing charts, tables and graphs...
Curated OER
Heartbeat Project
High schoolers enter information about their heartbeats into a spreadsheet. They construct data displays and calculate statistics. They describe and justify their conclusions from the data collected.
Curated OER
Endangered Species
Ninth graders graph data in order to compare the number of extinct species and a rise in human population. They analyze the data collected. Students are encouraged to infer the relationship.
Curated OER
A Fishy Tale
Eighth graders do a research project on a particular species of Atlantic seafood and record and graph information pertaining to commercial landings of that species of seafood. They use a website and an Appleworks spreadsheet.
Curated OER
Maximize It!
Students design a rectangular box without a lid that has the largest possible volume using the supplied sheet of centimeter graph paper. They work in groups to construct different size boxes to determine the largest possible volume and...
Curated OER
Excel Lesson Plan Coin Statistics
Second graders determine the difference between making a prediction and determining actual information. They design a spreadsheet for a coin flipping activity on which they include their predictions and what actual happens when they flip...
Curated OER
How Alike Are We?
Fourth graders find the range, mode, median, and mean for each of the data sets (height and shoe size). They discuss which measure of central tendency for each data set best represents the class and why. Students graph the shoe size and...
Curated OER
Death by Particles
Emerging epidemiologists define relative risk and read an article about the effect of particulate pollution on the cardiovascular health of women. They record the relative risk values, graph them, and answer analysis questions. This is a...
Curated OER
Molecular Biology and Primate Phylogenics
By counting differences in amino acids, biology stars examine the relationships between different primates. With information gleaned, they map out a phylogenic tree and discover common ancestry. You will need to create printable versions...
Curated OER
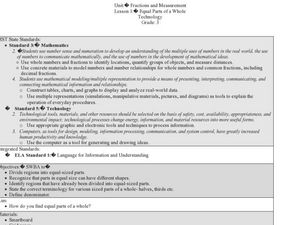
Fractions and Measurement
Using a Smart Board, or a plain ol' white board or chalkboard, the teacher pulls up a grid and demonstrates how squares and rectangles can be divided up into equal parts. The class will get their own graph paper to draw shapes and divide...
Curated OER
Market Basics: Demand, Supply, and Price Determination
Students are introduced to the concepts of supply and demand. Using the Law of Demand and Supply, they develop charts and graphic models of supply and demand. They compare and contrast the behavior of consumers and suppliers when there...
Other popular searches
- Tables, Charts and Graphs
- Tables Charts and Graphs
- Tables, Graphs, Charts
- Graphs Charts Tables
- Tables, Charts, Graphs
- Maps, Charts, Graphs, Tables


