Curated OER
Lift vs. Airspeed
Young scholars, after reading the explanation given below, use FoilSim and a graphing calculator to complete the activity to determine the relationship between airspeed and lift of an object by interpreting data.
Curated OER
Using 3-D Models for Code Validation with FoilSim
Students use FoilSim to complete the activity to create tables of data sets comparing the lift values for a 3-D model of a symmetrical wing section to the values predicted by the FoilSim software.
Curated OER
Fishkill
Students analyze data to determine the effect of thermal pollution on a certain species of fish. They graph temperature and dissolved oxygen and make inferences on the impact a change in temperature could have on the fish. As a class...
Curated OER
Virtual Field Trip
Learners calculate gasoline cost per mile on a virtual field trip. They calculate the gasoline costs and travel time for each of the 2 routes, and record on a data sheet. They use Excel to create data tables for mileage, gasoline...
Curated OER
Checking County Numbers
Learners use their county's information page to gather information about their community. Using the information, they create graphs from the tables provided and interpret the data. They write a paragraph showing their interpretation of...
Curated OER
What's Your Favorite Stuffed Animal?
Second graders gather information in a survey and interpret the results using a tally chart, a table, and a bar graph. They' present their results of the during the final group discussion. The subject of the survey is favorite stuffed...
Curated OER
Introduction to Science
Seventh graders investigate scientific methods to solve problems. They demonstrate creating data tables and graphs. They study the role of a scientist and the importance of safety in a science lab. They distinguish between an...
Curated OER
State Economy Chart
Fifth graders create a 3D Pie graph using the Chart Wizard in Excel to represent their assigned states' data. They discuss the similarities and differences between states, and form a hypothesis on the relationship between location and...
Curated OER
Firewood Problem
Students write and solve their own story problems. They determine the cost of firewood by the cord. They organize their data in graphs and charts.
Curated OER
Mobile of Information
Young scholars create a mobile of various geometric designs to be usend to display information from a variety of texts. They add graphics as well as graphs and charts, color, design and artwork to express the ideas learned through the...
Curated OER
The Bigger they Are . . .
Pupils do a variety of data analyses of real-life basketball statistics from the NBA. They chart and graph rebounding, scoring, shot blocking and steals data which are gathered from the newspaper sports section.
Curated OER
Tracking Sunrise and Sunset
Young scholars collect, record, and graph the sunrise and sunset times. They explain how the relationship between the tilt of Earth's axis and its yearly orbit around the sun produces the seasons.
Curated OER
Weather... Or Not
Students observe and discuss the local weather patterns, researching cloud types and weather patterns for cities on the same latitude on the Internet. They record the data for 6-8 weeks on a graph, and make weather predictions for their...
Curated OER
Foreign Stamps
Eighth graders convert the price of US stamps to those of a number of foreign currencies. They use conversion charts to make the changes.
Curated OER
A Day at the Beach
Student read Sheryl Wilson's story, "A Day at the Beach" while classifying items they find. They design a chart of the items before using educational graphing software to create a graph.
Curated OER
Measurement: Using the balance
Students use a balance and gram cubes to measure several different objects. They then record their results on a data chart and answer questions about them.
Curated OER
Bacteria Buddies
Tenth graders grow two different bacteria cultures. They count the colonies, and then use graphing calculators to predict the number of colonies that are going to appear. Students answer questions from their worksheet after completing...
Curated OER
Inventors Unit Survey
Students develop and conduct a survey for their inventors unit. They create a five question survey and tally the survey results, and create a graph using Microsoft Word and Graph Club 2.0.
Curated OER
Bears
Young scholars complete a variety of bear-related activities. They sort and graph teddy bears, distinguish between real and non-real bears and research bear life cycles and habitats.
Curated OER
Introduction to Scatter Plots and Correlation
Students examine the concept of scatter plots. They compare baseball statistics to locate the ones that correlate with winning, and identify the positive, negative, and no correlation in sets of data using MS Excel.
Curated OER
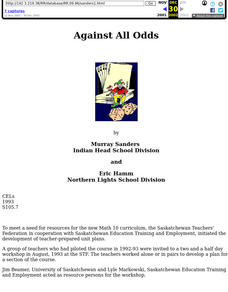
Against all Odds
Tenth graders appreciate the role of probability in understanding everyday situations. They Communicate a summary of financial projections in appropriate reports, tables, and graphs after creating a new game of chance.
Curated OER
Problem-Solving Strategies in Word Problems
Students examine how to determine which strategy to use to solve word problems. In this word problem strategy lesson, students listen to a lecture on the process of using different strategies to solve math problems. They look at guess...
Curated OER
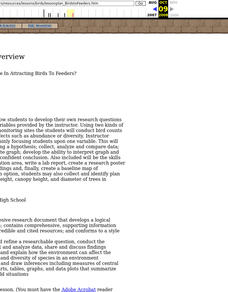
What Factors Contribute In Attracting Birds To Feeders?
Students develop their own research questions dealing with specific variables provided by the instructor; students conduct bird counts using two kinds of birdseed, and analyze possible effects such as abundance or diversity.
Curated OER
Protocol for Backyard Bird Research Project
Young scholars investigate a hypothesis about birds in their backyard using identification and survey skills.
Other popular searches
- Tables, Charts and Graphs
- Tables Charts and Graphs
- Tables, Graphs, Charts
- Graphs Charts Tables
- Tables, Charts, Graphs
- Maps, Charts, Graphs, Tables
- Charts, Graphs and Tables


