Curated OER
Wiggle Worms
First graders investigate worms, collect and analyze data. In this worm and data lesson, 1st graders listen to Chick and Duckling from the Macmillan/McGraw-Hill reading series. They conduct experiments with worms, collect simple data,...
Curated OER
Scientist Tracking Network
Students correlate surface radiation with mean surface temperature of several geographic regions. They observe how these parameters change with latitude and construct an understanding of the relationship of solar radiation to seasonal...
Curated OER
Using Vegetation, Precipitation, and Surface Temperature to Study Climate Zones
Middle schoolers begin their examination of the climate zones found around the world. Using a software program, they identify the relationship between the vegetation, climate and temperatures of the different zones. They also plot...
Curated OER
Mummy Dearest
Students assess what environmental conditions best contribute to preservation and mummification by participating in a multi-day 'apple mummification' lab.
Curated OER
THE TRAVELS OF BABAR: An Adventure in Scales
Young scholars locate and identify the seven continents. They use longitude and latitude in establishing a location. Students enhance the knowledge of geographical location with cultures. Individuals or small groups research multiple...
Curated OER
Math Medicine
Young scholars solve real-world problems related to medical careers. They use graphical representations as part of the problem-solving process and work with fractions, decimals, exponents, and metric measurement. A demonstration is...
Curated OER
How is a Star's Color Related to Its Temperature?
In this star color and temperature worksheet, students create a Hertzsprung-Russell diagram in order to determine how star brightness, color, temperature, and class are related. Once diagram is complete, they answer 6 short answer...
Curated OER
Slow Rot or Not?
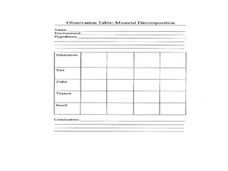
Fifth graders examine how environmental factors affect decomposition. In this decomposition lesson, 5th graders experiment with the decomposition of grapes in five different environmental settings. They look at images of items that have...
Curated OER
Observing and Sketching the Lunar Surface
Students explore space science by conducting an illustration activity. For this lunar lesson, students discuss what the moon is and the role it plays for our environment on Earth. Students view images of the moon and utilize chalk to...
Curated OER
Favorite Christmas Carols
Third graders take a survey of friends' and family members' favorite Christmas carols. They illustrate a favorite Christmas carol and have students try to guess the name of the carol based on the picture.
Curated OER
Teenage pregnancy trends in Canada
Young scholars analyze demographic data relating to teen pregnancy trends. They develop skills to locate and interpret data. They discuss the factors that influence teenage pregancy such as social, economic, and educational issues.
Curated OER
What's the Matter? (Grade 3)
Third graders organize information about the three types of matter and to reinforce concepts learned in the matter unit of the science curriculum. They use Inspiration software to create a concept map of the three types of matter.
Curated OER
Create A Park Map
Students design ultimate park experience for Florida families as they demonstrate their knowledge of map legend skills.
Curated OER
Do Medicines Grow on Trees and Plants?
Students study the importance of preserving rainforest. They investigate the uses of rainforest plants for medicinal uses by participating in rainforest immersion activities.
Curated OER
Let's Keep Track of Grades
Students participate in a technology project. This lesson is a hands-on spreadsheet project where students are responsible for keeping track of their grades for class. The students learn to enter data into a spreadsheet, create...
Curated OER
Career Exploration
Students complete a unit about career choices. They conduct research on a selected career that interests them, conduct an interview, explore various websites, create a five-page HyperStudio stack, and write ten checks that relate to...
Curated OER
Aquifer Model
Students, after researching and brainstorming about aquifers and locating aquifer maps of Texas, participate in the building of a model of an aquifer complete with a pumping station. They also answer a variety of questions at the...
Curated OER
Investigating Bean Pods and How They Grow
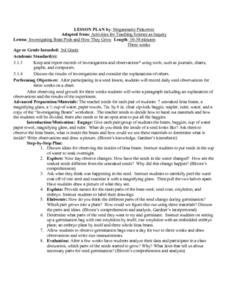
Third graders observe and create a record of seed growth over time. After planting a seed, 3rd graders record their observations of the seed's growth over a three week period. Upon conclusion of the experiment, they write a paragraph...
Curated OER
Ocean Currents and Sea Surface Temperature
Students use satellite data to explore sea surface temperature. They explore the relationship between the rotation of the Earth, the path of ocean current and air pressure centers. After studying maps of sea surface temperature and ocean...
Curated OER
Mapping The Ocean Floor
Young scholars explore and analyze the bottom structure of underwater habitats. They describe and explain what can't see through the collection and correlation of accurate data. Learners assess that technology is utilized as a tool for...
Curated OER
My Family Tree
Students create a family tree. In this ancestry lesson plan, students research a country that one of their ancestors is from. Students interview a grandparent and map out a family tree.
Curated OER
Using Primary Sources to Discover Reconstruction
Fifth graders discover how reconstruction had an impact on racial issues in the United States. In this Reconstruction lesson, 5th graders are introduced to primary vs. secondary resources and then rotate through stations to view...
Curated OER
Who Is Sarah Mae Fleming?
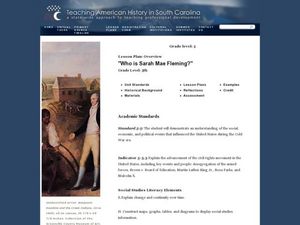
Fifth graders learn about two influential women. In this historical figures lesson, 5th graders work in groups to read articles about Rosa Parks and Sarah Fleming and share their findings with the class. Students use a Venn Diagram to...
Other popular searches
- Tables, Charts and Graphs
- Tables Charts and Graphs
- Tables, Graphs, Charts
- Graphs Charts Tables
- Tables, Charts, Graphs
- Maps, Charts, Graphs, Tables
- Charts, Graphs and Tables


