Other
Tulpehocken Area School District: Graphing and Analyzing Scientific Data
Student instructional activity with explanation of pie, bar, and line graphs, the parts of a graph, and the definition of mean, median, and mode. This summary is followed by an exercise for each type of graph within a scientific context.
University of Cambridge
University of Cambridge: Maths and Sports: Charting Success
Sports statisticians, trainers and competitors create graphs, charts and diagrams to help them to analyse performance, inform training programmes or improve motivation. This activity encourages students to consider and analyse...
Oswego City School District
Regents Exam Prep Center: Practice With Organizing and Interpreting Data
Several problems are presented to test your skills in creating and interpreting frequency tables, pie charts, box-and-whisker and stem-and-leaf plots.
Texas Instruments
Texas Instruments: Mc Dougal Littell Middle School Math: Making Data Displays
Students will create data displays using a scatter plot and a line graph of the data and a circle graph of survey data.
Texas Instruments
Texas Instruments: Creating Charts
Students learn to represent data in a list as a bar chart. They examine statistics from the 2000 Olympic Games and determine the team that took home the most medals.
ClassFlow
Class Flow: Graphing Lists Tables
[Free Registration/Login Required] This lesson plan flipchart provides opportunities for interpreting information in simple tables and graphs.
Other
Bucks County Community College: Visual Organizers
This site walks you through the benefits of visual organizers, and focuses on a variety of types: tables, charts, graphs, timelines, flowcharts, diagrams, and webs.
University of Cambridge
University of Cambridge: Maths and Sports: Match the Matches
Decide which charts and graphs represent the number of goals two football teams scored in fifteen matches. This data handling activity is designed to get children talking meaningfully about mathematics, presenting and justifying...
Sophia Learning
Sophia: Using Graphs to Analyze Data
This lesson will demonstrate how to analyze and interpret data given in the form of a graph.
Web Elements
Web Elements Periodic Table: Yttrium
At this site from Mark Winter at WebElement, you can navigate around for charts and graphs of data on Yttrium. Probably the most comprehensive of all periodic tables on the web.
Khan Academy
Khan Academy: Creating Dot Plots
Practice creating dot plots. Dot plots are very similar to frequency tables, but they make it easier to see the data. Students receive immediate feedback and have the opportunity to try questions repeatedly, watch a video or receive hints.
Richland Community College
Richland Community College: Stats Graphs Defined
Richland Community College provides a glossary of many terms that are needed in order to understand statistics graphs and charts. Each of the types of charts is quickly explained in terms of what it is most effective in displaying.
Illustrative Mathematics
Illustrative Mathematics: Color Week
Five-year-olds need to count things that relate to them. This activity builds on their need to be included or see the relevance of their counting. Students will practice counting, writing numbers, and filling in a chart or bar graph....
Discovery Education
Discovery Education: Science Fair Central: Investigation Set Up and Collect Data
A brief overview of how to gather both quantitative and qualitative data, complete with a sample data table.
ClassFlow
Class Flow: Interpreting Tables and Graphs
[Free Registration/Login Required] Explore a variety of graphs and tables. Many activities are incorporated to provide practice solving problems using different graphs and charts.
US Energy Information Administration
U.s. Eia Energy Kids: Nonrenewable Energy Sources
This resource provides information about nonrenewable energy sources. There is specific information about each of these energy sources, and lots of maps, charts, tables, and graphs to further the understanding.
ClassFlow
Class Flow: Cumulative Frequency Data Handling
[Free Registration/Login Required] Students draw conclusions and engage in tables and charts involving cumulative frequency; a wonderful review of student's knowledge.
Simon Fraser University
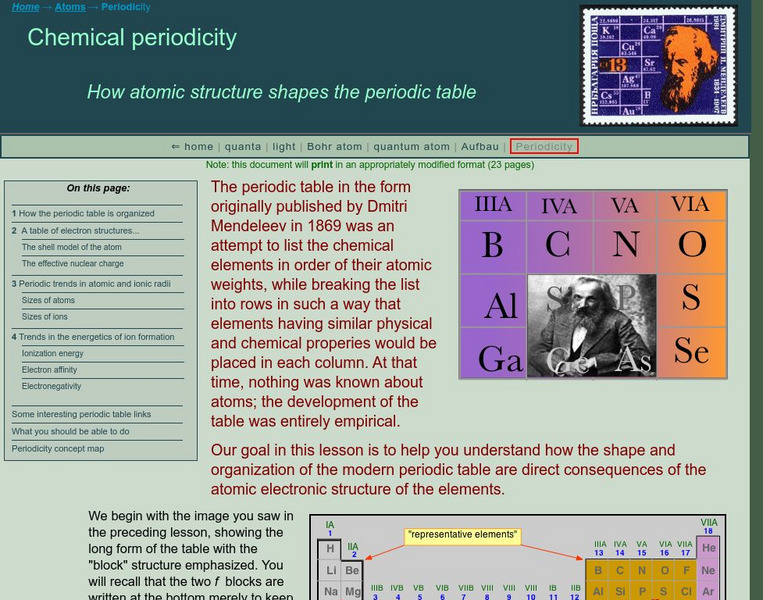
Chem1 Virtual Textbook: Periodic Trends in Ion Formation
Acting as a subtopic of the General Chemistry Virtual Textbook's section on Atoms and the Periodic Table, this site discusses electron affinity and ionization energy in relation to ion formation. Charts and graphs are included as well.
Texas Education Agency
Texas Gateway: Data Analysis
Given laboratory investigation data in the form of tables, charts, and graphs, students will analyze and predict trends from the data.
Khan Academy
Khan Academy: The Sat Reading Test: Overview
This is an overview of what to expect on the SAT Reading Test. It assesses your ability to read and interpret a variety of texts similar to the reading you will find in college and your career. All of the questions on the reading test...
University of Cambridge
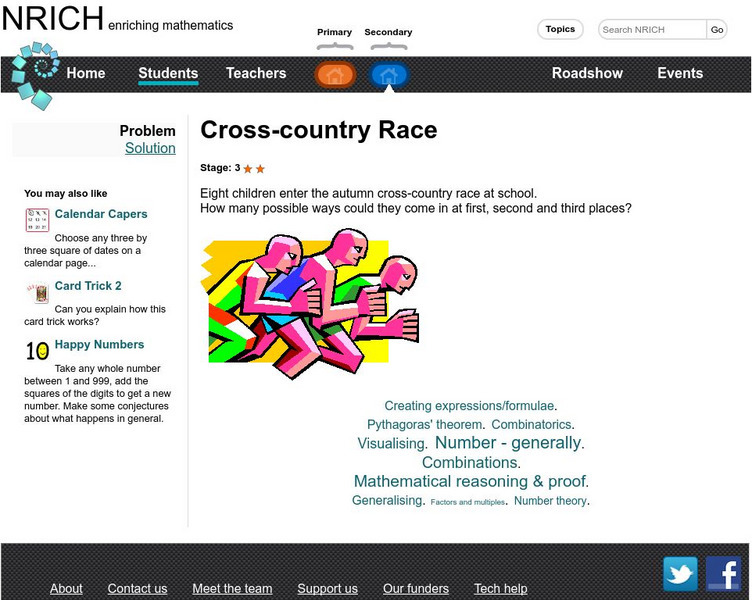
University of Cambridge: Nrich: Cross Country Race
On this one page website sharpen your logic and problem solving skills while working on this challenge. The solution is available to double check your solution.
Alabama Learning Exchange
Alex: Ice Cream Sundae Survey
Students quickly realize the importance of learning how to read and find information in charts, graphs, and tables compared to finding the same information written in a paragraph. This is a fun, high energy lesson!This lesson plan was...
CK-12 Foundation
Ck 12: Types of Data Representation: Graphic Displays of Data
[Free Registration/Login may be required to access all resource tools.] Here you will explore displays of data using bar charts, histograms, pie charts and boxplots, and learn about the differences and similarities between them and how...
Alabama Learning Exchange
Alex: Who Bounces Best?
This is a cooperative learning, kinesthetic and presentation lesson. Learners will use the computer to create graphs/charts to display data collected by counting the number of successful bounces when bouncing a basketball for 30 seconds....
Other popular searches
- Tables, Charts and Graphs
- Tables Charts and Graphs
- Tables, Graphs, Charts
- Graphs Charts Tables
- Tables, Charts, Graphs
- Maps, Charts, Graphs, Tables
- Charts, Graphs and Tables


