Virginia Department of Education
Igneous Rocks
High schoolers explore igneous rocks by observing rock samples and considering cooling rates and composition. The third installment of a five-part geology series culminates in an activity where learners use igneous rock characteristics...
Curated OER
Visual Literacy: Using Images to Increase Comprehension
A colorful PowerPoint is a great way to introduce the topic of visual literacy. The eye-catching presentation begins with an overview of visual literacy and then provides some specific strategies to help enhance reading comprehension. As...
American Battlefield Trust
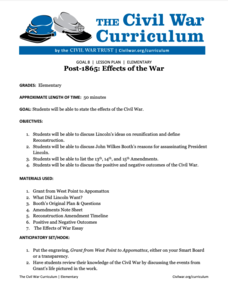
Post-1865: Effects of the War
What did Lincoln want? Historians still debate this question, and perhaps people will never fully know. Class members examine the legacies of the war, including the Thirteenth, Fourteenth, and Fifteenth Amendments. The lesson plan also...
EngageNY
Interpreting, Integrating, and Sharing Information about DDT: Using Cascading Consequences and Fishbowl Protocol
What is your interpretation? Scholars look at their Cascading Consequences Charts and interpret the information they have gathered. Learners match claims with evidence and then watch a video. At the end, they carry out a fishbowl...
Curated OER
Getting Graphs: Researching Genealogy-A Piece of Pie
Third graders research their genealogy. In this math lesson, 3rd graders collect data and create graphs and charts. A presentation of their findings is given.
Curated OER
What Pie?
Students practice making and interpreting pie graphs so they are better able to decide if a pie chart is the appropriate form of display. Students examine included overheads of different pie charts, and directions on how to make pie...
Curated OER
Writing Own Tale
Third graders read The First Strawberries and complete a character chart. In this writing a tale lesson, 3rd graders discuss viewpoints and identify character traits. Students complete character charts and write their own tale about how...
Curated OER
Dynamite Data
Second graders rotate through a variety of stations designed to offer practice in manipulating data. They sort, tally and count items and then create bar graphs, tables, and pie graphs to record their findings.
Curated OER
Diversity of Languages
Learners interpret graphs and statistics to recognise and understand the cultural and linguistic diversity of Australia. They create a profile of the linguistic diversity of the class or school. Students discuss Australia's cultural...
Curated OER
Let the Games Begin!
Third graders use K-W-L charts to brainstorm a list of questions they would like to answer about sports. While visiting a Web site, 3rd graders research a chosen sport and complete their K-W-L chart.
Curated OER
Data Handling
In this data handling worksheet, 6th graders solve and complete 4 various types of problems. First, they draw a bar chart to represent the information provided in the table shown. Then, students show beneath the table how to work out the...
Curated OER
Graph a Panther's Diet
Pupils examine the diet of panthers. In this interpreting data instructional activity, students collect data on the panther's diet and chart the data in bar and pie graphs.
Curated OER
Dealing With Data
Students collect, organize, and display data using a bar graph, line graph, pie graph, or picture graph. They write a summary describing the data represented and compare the graph to another graph in the class.
Curated OER
Favorite Candy Bar Graph
Students decide on six different types of candy bars to include in a data collection activity. Working in small groups, they survey a target group in a set amount of time. They access a Internet based graphing tool to create a bar graph...
Curated OER
Collecting Data
In this data collection worksheet, students read about how data is collected and organized. They also learn about a hypothesis. Students read through examples of different charts and then answer 23 questions pertaining to data...
Curated OER
Free Printables: Easy Graphs
In this counting and charting worksheet, students compete the chart using either colors or the stickers provided. Teachers can determine the subject of the chart by using the worksheet generator.
Curated OER
Deciding Which Type of Graph is Appropriate
In this graphing instructional activity, students read about line, bar, and pie graphs and then determine which graph is the best way to express data results. This instructional activity has 3 short answer questions.
Curated OER
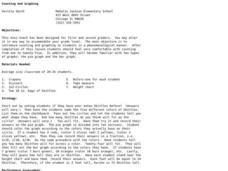
Counting And Graphing
Students explore counting and graphing. In this math lesson plan, students practice counting from 1-25 and are exposed to two types of graphs: the pie graph and the bar graph. Students use Skittles to represent a variety of measurements.
Curated OER
Relative Dating - Telling Time Using Fossils
Students use fossil range charts to explain relative dating. They graph for ammonites, marine organisms that went extinct at the same time as dinosaurs.
Curated OER
Statistical Inquiry
In this statistical inquiry worksheet, students analyze and interpret a variety of diagrams such as a scatter plot, bar graph and pie charts. They create tables and other diagrams to support given data. This two-page worksheet contains 3...
Curated OER
Critter Encounter Chart
Students record data found at an assigned web site. In this data collection lesson, students access an assigned web site in order to complete a data chart about animals they see. They travel to different sections of the web site to find...
Curated OER
Drift Study
Students observe, work with charts, and work with GPS in order to determine the path lobster larvae travel based on local currents. In this currents lesson plan, students work with local fishermen to observe the natural currents.
Curated OER
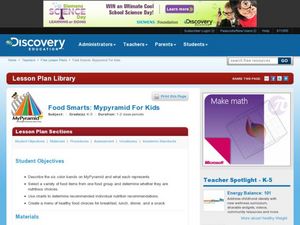
Food Smarts: Mypyramid For Kids
Students create a menu based on the nutritious choices they pick out from MyPyramid and the video they watch. In this nutrition lesson plan, students describe what each color band on the pyramid represents, use charts, discuss nutrition...
Curated OER
BUS: Farming: It's A Fact (Ag)
Students create two different types of graphs from the information in the "Farm Facts" booklet (i.e., bar graph, pie chart, etc.). They calculate where your food dollars are spent (on and off farm).
Other popular searches
- Charts and Graphs
- Multiplication Charts
- Maps and Charts
- Tally Charts
- Pie Charts and Graphs
- Pie Chart
- Multiplication Charts to 100
- Reading Charts and Graphs
- Behavior Charts and Graphs
- Charts and Graphs Candy
- Interpret Charts and Graphs
- Charts and Graphs Christmas


